

Some Background: Communities designated as food deserts have limited access to healthy and nutritious food options, which further leads to a higher prevalence of heart disease, diabetes, obesity, and cognitive deficits. Moreover, food deserts are generally populated by lower income African Americans and Latinos. Although many factors contribute to the persistence of food deserts in the U.S., recent research has pointed to supermarket redlining practices as an important contributor. That is, decision makers involved in site location decisions avoid communities of color, especially those designated as food deserts, due to perceptions of high crime rates, insufficient income, lower population density, and other factors. Unfortunately, site selection decisions are often not supported by actual evidence of these perceptions, while myths and stereotypes are used to justify a decision to establish a supermarket in more desirable communities. In a recent study of a community in Dallas, Texas with several food deserts (2), our research team discovered the following:
- Crime rates were not substantially higher in communities with food deserts compared to non-food deserts.
- Estimated annual food-at-home expenditures depended minimally on average household income, and were more strongly associated with the number of household members, aggregate household income, and SNAP benefits.
- Based on our research, we identified several food deserts with sufficient economic potential to sustain the average sales of a U.S. supermarket.
Despite this evidence, supermarket executives in the Dallas area continue to avoid these communities, forcing residents to travel outside of their communities to purchase healthier and more affordable food, or continue shopping at local convenience or dollar stores that offer food options that are less healthy and more expensive. Since many communities throughout the U.S. are experiencing the same challenges. our research has the potential to encourage more investment by food retailers in such communities.
GIS Services: Following are selected services that we can provide to interested organizations:
- Map showing the location of retail or other establishments
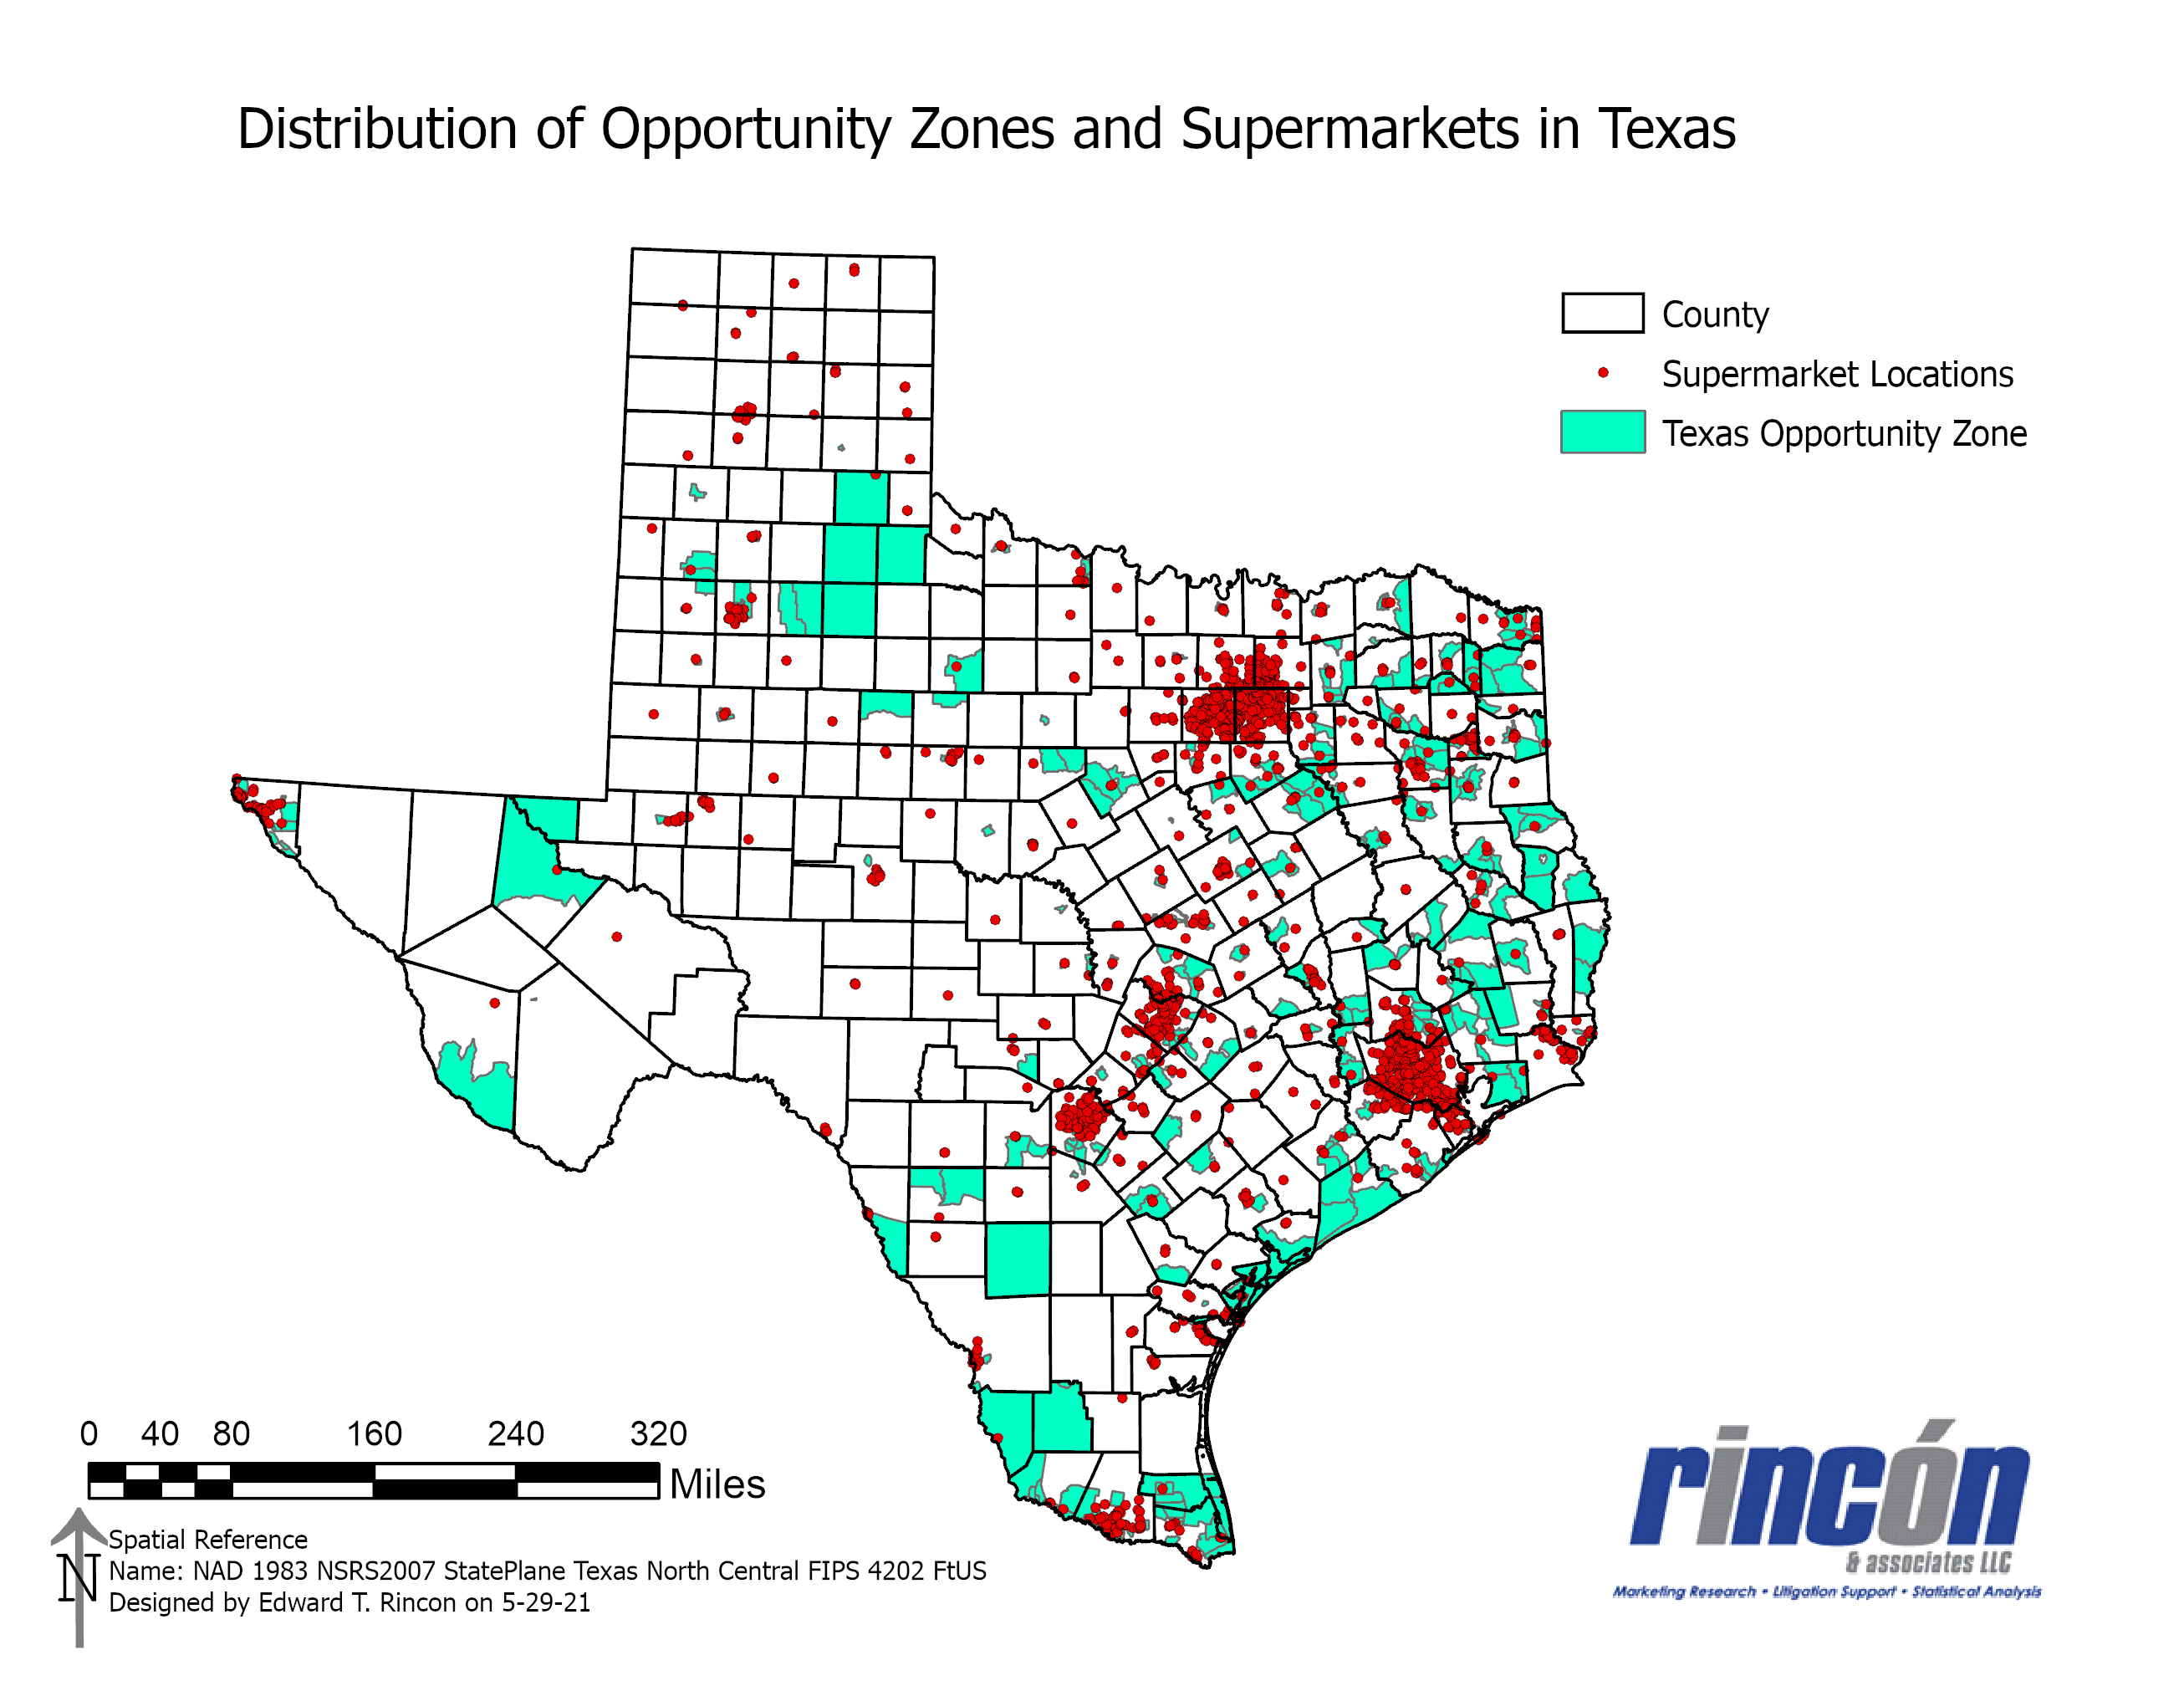
- Map showing Opportunity Zones designated by IRS to obtain a tax exemption. For information on Opportunity Zones, click here.
- Map showing traffic counts
- Map that includes 3-5-10 mile buffers or rings around a location along with population demographics for each buffer zone
- Ability to geo-code customer locations for display in a map
- Demographic information from the most recent Census Bureau files
In 2021, there were 2,000 supermarkets and 628 Opportunity Zones in Texas. Click here to view a map that illustrates their distribution in Texas.
To obtain a quote for any of these services, please contact Dr. Edward T. Rincón at edward@rinconassoc.com.
Disclaimer: Rincón & Associates LLC does not make any warranties, either expressed or implied, as to the accuracy of any data or information using secondary sources of information and shall not be liable for any direct on or indirect, consequential, special or incidental damages due to any action taken or not taken by a user or customer as a result of any data or information gathered using these products. The user or customer should exercise due diligence in using these products or services.