

In the several post-mortems of the 2020 election, one key question has remained unanswered: Are Latino voters really embracing Donald Trump — the same guy that referred to Latinos as rapists and criminals, separated immigrant children from their families, accused of sexually assaulting several women, and referred to soldiers who lost their lives in battle as “suckers and losers”? Because Trump was able to capture a higher percentage of Latino votes in Florida and South Texas compared to the 2016 election – various journalists and political pundits signaled an alarm bell suggesting that the future of the Democratic Party in Texas and Florida was in peril.
It is curious that these limited Trump victories were portrayed as an existential crisis for the Democratic Party, especially in light of CNN exit polls showing that U.S. Latinos overwhelmingly supported Biden (66%) over Trump (32%) [1] — an outcome, by the way, that matched Latino support for Hillary Clinton in 2016. The following statements illustrate the warnings that accompanied Trump’s victory in South Texas:
“That erosion in an area considered a Democratic stronghold – is a warning sign to the party as it tries to flip the state. It also serves as a stark reminder that the Latino vote is diverse, especially in a state like Texas. And that Democrats cannot take it for granted.” [2]
“And Trump, instead of being a complete drag on Cornyn, turned in eye-popping numbers in heavily Hispanic counties in South Texas.” [3]
“…such Hispanics joined conservative voters in urban and suburban areas to ‘deliver the message that life, liberty, law and order, Texas values and our Second Amendment rights are their top priority.” [4]
Especially interesting were the various attempts to explain the motivations for Trump’s newly found success among Latino voters in South Texas and Florida. To explore these motivations, reporters from the New York Times,[5] CNN [6] and Dallas Morning News [7] captured a variety of subjective impressions, or theories, from interviews with local legislators, community leaders, academics, and Hispanic voters. Following are seven distinct “theories” expressed by these stakeholders as justification for supporting Donald Trump along with factual information that we believe casts some doubt on these theories.
· The Jobs Theory: Concerns were raised that abolishing ICE would hit home to many Latinos that worked in homeland security and as Border Patrol agents, and also threaten jobs in the oil and gas industry. However, a 2019 report on the South Texas economy issued by the Texas State Comptroller’s Office [8] reported the following employment picture: (a) the number of jobs in South Texas related to justice, public order and safety activities were 29,654, representing 2.9 percent of all jobs in the region, (b) the four military installations in the region provided 41,044 jobs which represented 6.5 percent of all military jobs in Texas, and (c) 4,794 jobs or 0.57 percent of all jobs in the region were concentrated in the oil and gas or petroleum and coal products manufacturing industries. Taken together, these three industries accounted for a relatively small percentage (9%) of all jobs in the South Texas region. Moreover, the oil and gas industry in Texas had already lost 51,000 jobs due to steep declines in demand and prices resulting from the pandemic that occurred under the watch of the Texas Republican administration.[9] The large presence of military jobs may suggest a heightened sense of loyalty to the current president; however, did this sense of loyalty change when Donald Trump publicly disparaged military leaders, heroes and soldiers?
· The Shared Values Theory: Some Latinos believed that Republicans shared similar values with Hispanic culture related to family, life and religious freedom. Trump’s family values are questionable given the numerous allegations of sexual assaults on women. And while Hispanics may value pro-life or anti-abortion policies, it is noteworthy that, according to a CDC 2016 report on statewide abortions,[10] Hispanic women nevertheless reported 20,667 abortions or 38.7 percent of all abortions in Texas. Regarding religious freedom, some Hispanics felt that Trump “brings God to our country” and values religious freedom. Yet Trump has publicly voiced his intolerance for people of different religions, such as Muslims.
· Communications Theory: Trump was described as a plain speaker. Indeed, Trump has managed to use plainly worded insults and profanity towards women, Latinos, Blacks, the disabled, athletes and war heroes. Trump also uses plain language when addressing public policy issues because his knowledge is very limited.
· The Macho Theory: To some Hispanics, especially males, Trump’s macho style was appealing. Machos tend to be authoritarian and domineering, lack emotional investment, and believe that women should be subservient to males. Considerable research, however, regarding Hispanic family dynamics confirms that Hispanic women are the primary decision-makers in the typical Hispanic household. [11]
· The Exploited Theory: Several Hispanics believed that Democrats took them for granted while Republicans gave them a voice. This theory has merit since the Democratic campaign in Texas was missing in action until the final week of the 2020 election, while Republicans launched aggressive campaigns in Florida and South Texas to capture the Latino vote. Nonetheless, the South Texas region remains one of the poorest regions in Texas and has progressed little economically under the Republican leadership over the past decade.
· Law and Order Theory: Trump was believed to support the police, law and order, and against defunding the police. But Trump publicly praises white supremacists and encourages supporters to use violence against Biden supporters and current government officials such as Michigan Gov. Gretchen Whitmer. During the Trump administration, the number of hate crimes reported by the FBI have increased as well [12] [13]
· Socialist Theory: In Florida, Republicans utilized social media, outdoor parties and churches to promote the false message that Joe Biden was sympathetic to socialist dictators like Hugo Chavez and Fidel Castro – which Cubans and Venezuelans strongly disliked. Despite being false, however, the strategy was successful in creating stronger support for Trump in Florida.
While these theories are interesting, one should keep in mind that they are merely subjective impressions of Trump’s appeal that should not be generalized to Hispanics in South Texas, Florida or other communities. Nonetheless, two disturbing attributes seem to emerge after reviewing these “theories:” a departure from reality and a distinct level of gullibility. That is, Latino Trumpers reveal a tendency to reject the facts related to an issue and seem easily deceived by the myths and distortions of the truth promoted by the Republican Party – attributes that are common among general Trump supporters. The gullibility attribute in Latinos stems from a general tendency to be more trusting of others than non-Latinos, although trust in government has clearly declined in recent years. Immigrants with limited English-speaking skills are more likely to trust Spanish-language media that they are better able to understand. Like the elderly, less acculturated Hispanics are less likely to be suspicious of the many scams and telemarketers that contact households on a daily basis and are often victimized according to annual fraud reports by the Federal Trade Commission. During 2011, 13.4 percent of Hispanics were victims – almost 50 percent higher than the rate for non-Hispanic whites. [14] Sadly, Spanish-language media is frequently used as the vehicle to victimize Hispanics, a practice that was successfully utilized by Republicans in Florida. Republican campaign strategists probably discovered these attributes early in the 2020 campaign and utilized it to their advantage in Florida, Texas and perhaps other communities. The ability to identify communities of Latinos that fit the Latino Trumperprofile is a clear advantage for the Republic Party, especially in communities that the Democratic Party chooses to ignore.
Despite these two victories, there is reason to believe that Biden did not lose Texas due to weak Latino support from the South Texas region. To understand this point, let’s first review some basic information about the voting population in South Texas.
Profile of South Texas
To understand the voting outcomes in South Texas during the 2020 election, it is helpful to first understand some of the demographic and economic characteristics that distinguish this region from the state’s population. We will summarize some of the information provided in a summary report of the South Texas region by the Texas State Comptroller’s Office.[15] The South Texas region includes 28 counties as shown by the yellow highlighted area in the following map (see Figure 1 below):
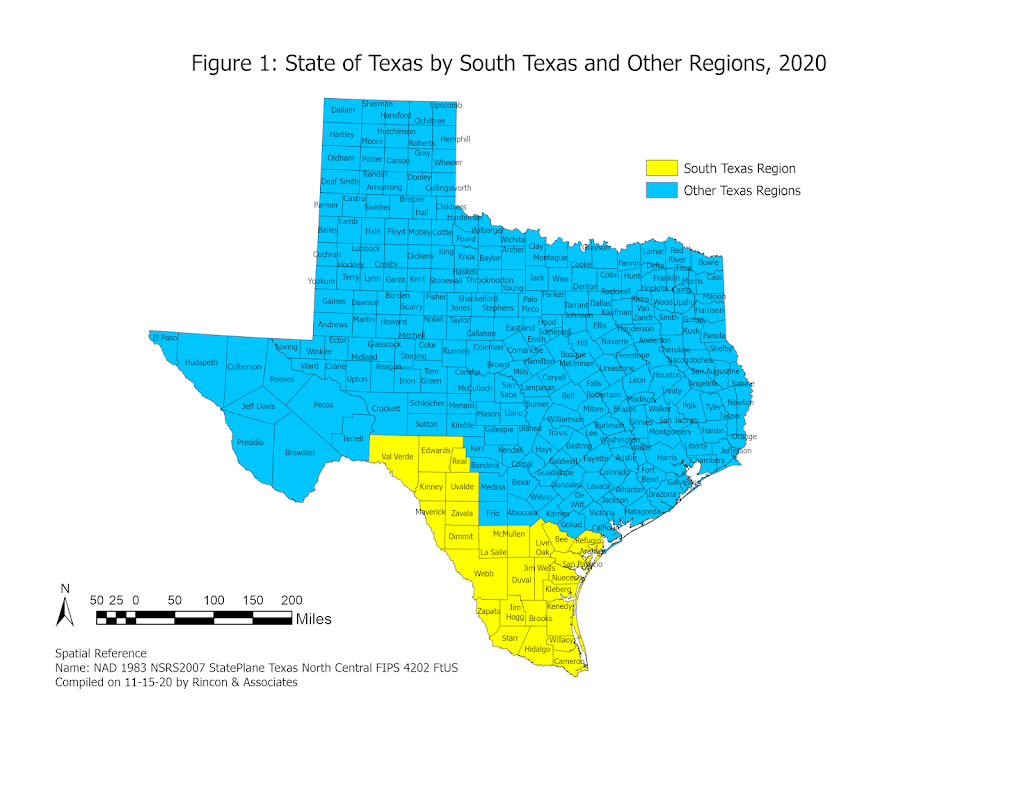
The 2019 estimated population for South Texas was 2.4 million, representing 8.4 percent of the total population in Texas. Between 2010 and 2019, the region has grown more slowly (7.4% rate) than the state’s growth rate (15.3%). The region’s population is predominately Hispanic (83%), one of the poorest in the state with a per capita income of $31,965 compared to $50,355 for Texas, and has an unemployment rate nearly twice as high (5.3%) as Texas (3.5%). The percentage of persons with a bachelor’s degree or higher in 2018 was decidedly lower in South Texas 17.8%) than the state (29.3%).
Table 1 below shows the number of registered voters in Texas compared to South Texas. The number of registered voters in South Texas represented less than 1 percent (0.6%) of the total number of registered voters in Texas. Due to its small number of registered voters, the South Texas region does not appear particularly influential in the 2020 presidential election.
Table 1: Registered Voters by Regions, 2020
|
Geographic Area |
Number |
Percent |
|
Texas |
16,955,519 |
100.0 |
|
South Texas |
103,833 |
0.6 |
|
Other Regions |
16,851,686 |
99.4 |
Table 2 below shows that 11,071,502 million Texans voted during the 2020 election – a voter turnout of 65.3 percent. Of these total voters, 52.9 percent supported Donald Trump while 47.1 percent supported Joe Biden. Compared to the state, support for Trump was slightly higher (54.4%) in South Texas..
Table 2: Texas Votes Cast for Presidential Candidates, by State
and South Texas Region, 2020
|
Geographic Area |
Total |
Trump |
Biden |
|
Texas |
11,071,502 |
5,860,096 |
5,211,406 |
|
Percent |
100.0 |
52.9 |
47.1 |
|
South Texas |
53,807 |
29,1 70 |
24,537 |
|
Percent |
100.0 |
54.4 |
45.6 |
|
Source: https://results.texas-election.com/county |
|||
Although it will be some time before we know the final votes cast in the 2020 election by race-ethnicity, a preliminary picture of the voting outcomes in Texas, Florida and Arizona were provided by CNN exit polls on election day. [16] An election exit poll is a poll of randomly selected voters that is taken immediately after they have exited a polling station. Exit polls can be affected by non-response bias, language bias, and clustering sampling methods that have been criticized for excluding Spanish-speaking voters who often vote for Democratic candidates.[17] Table 3 below summarizes the results for Texas that included 4,768 voters. Statewide Latino support for Joe Biden was higher (58%) than South Texas (45.6%) while statewide Latino support was lower for Donald Trump (41%) than South Texas (54.4%). Table 4 shows that in Florida the margins for Latino support were closer but still higher for Joe Biden (52%) than Donald Trump (47%). Table 5 shows that in Arizona, Latinos strongly supported Joe Biden (63%) over Donald Trump (36%).
Table 3: Exit Poll Outcomes for Texas Presidential Candidates, 2020
(Percent)
|
Candidate |
Race-Ethnicity of Voter |
|||
|
White |
Black |
Latino |
Asian |
|
|
Donald Trump |
66 |
9 |
41 |
30 |
|
Joe Biden |
33 |
90 |
58 |
63 |
|
Source: CNN Exit Polls, n = 4,768 |
||||
Table 4: Exit Poll Outcomes for Florida Presidential Candidates, 2020
|
Candidate |
Race-Ethnicity of Voter |
|||
|
White |
Black |
Latino |
Asian |
|
|
Donald Trump |
61 |
9 |
47 |
n/a |
|
Joe Biden |
38 |
89 |
52 |
n/a |
|
Source: CNN Exit Polls, n = 5,906 ( n/a = sample to small to project) |
||||
Table 5: Exit Poll Outcomes for Arizona Presidential Candidates, 2020
|
Candidate |
Race-Ethnicity of Voter |
|||
|
White |
Black |
Latino |
Asian |
|
|
Donald Trump |
51 |
n/a |
36 |
n/a |
|
Joe Biden |
47 |
n/a |
63 |
n/a |
|
Source: CNN Exit Polls, n = 1,639 (n/a = sample too small to project) |
||||
To obtain a more detailed picture of candidate support at the county level for South Texas, Table 6 below presents the eight “heavily Hispanic” counties in South Texas that were included in the recent analysis by the Dallas Morning News [18] and used as the basis for sounding the alarm bell to Texas Democrats. Frio County was included in their analysis although it is part of West Texas. The table reveals that support for Donald Trump ranged from 50 to 66 percent; the region produced a total of 8,975 college graduates who were 25 years or older; and there were high concentrations of Hispanics that ranged from 73 to 94 percent (median of 83%). The region showed only 103,833 registered voters.
Table 6: Heavily South Texas Hispanic Counties Carried by Trump
|
County |
Total Registered Voters |
No. Hispanic College Graduates 25yrs & Over |
Percent Voted for Trump |
Percent Voted for Biden |
Pct. Hispanic Pop. 2018 |
|
Frio (West Tx) |
8,984 |
500 |
53.7 |
46.3 |
78.8 |
|
Jim Wells |
26,636 |
1,784 |
54.8 |
45.2 |
80.3 |
|
Kenedy |
296 |
12 |
66.1 |
33.9 |
87.7 |
|
Kleberg |
18,749 |
2,254 |
50.9 |
49.1 |
72.7 |
|
LaSalle |
4,426 |
345 |
55.9 |
44.1 |
82.4 |
|
Reeves |
7,558 |
431 |
61.7 |
38.3 |
75.1 |
|
Val Verde |
28,927 |
3,021 |
55.0 |
45.0 |
81.8 |
|
Zapata |
8,257 |
628 |
52.8 |
47.2 |
94.2 |
|
Total 8 Counties |
103,833 |
8,975 |
54.4 |
45.6 |
83.0 |
Source: https://results.texas-election.com/county / ACS 2018 5-Year Estimates.
Previous polling of U.S. Latinos by the Pew Research Center revealed that Joe Biden’s support was distinctly higher for college graduates (69%) than non-college graduates (61%).[19] The percentage of college graduates in the South Texas region was 17.8 percent, which was distinctly lower than the State of Texas (29.3%) and the U.S. (31.5%). [20] The South Texas region produces its share of college graduates, but many move away due to a poor economy, leaving only 8,975 graduates who resided in the region in 2018. The political potential of South Texas is limited by the small number of registered voters and college graduates.
In our opinion, the high percentage of Hispanics in the South Texas region (83.0%) is perhaps the key factor that attracts the attention of political candidates, journalists and pundits who tend to portray South Texas as the bell weather region for Texas Latino politics. However, the focus on percentages can be misleading as an indicator of political influence when the population base and number of registered voters is small in comparison to other regions in Texas.
Considerably greater political benefit was realized by the Biden campaign in larger urban areas in Texas with higher numbers of Hispanic registered voters and college graduates. Table 7 below page presents a similar profile for the top five Texas counties ranked by the total number of registered voters. It is readily apparent that these five counties included a much larger number of registered voters (7.1 million) and more Hispanic college graduates (449,751) despite having a more moderate concentration of the Hispanic population ranging from 29 to 60 percent (median = 41%). More importantly, support for Joe Biden was distinctly higher than the South Texas region, ranging from 50 to 73 percent. Interestingly, Travis County had one of the lowest percentages of the Hispanic population (33.9%), yet also revealed the highest level of support for Joe Biden (73.0%) – an affirmation of the political power leveraged by the college-educated community surrounding The University of Texas at Austin. Thus, a moderate concentration of Hispanics coupled with a substantial college-educated community appears to have substantially contributed to Joe Biden’s standing in Texas.
Table 7: Voter Profile of Top 5 Texas Counties Ranked by Number of Registered Voters
|
Top 5 Counties |
Total Registered Voters |
No. Hispanic College Graduates 25yrs & Over |
Pct. of All Votes for Trump |
Pct. of All Votes for Biden |
Pct. Hispanic Pop. 2018 |
|
Harris |
2,480,522 |
140,157 |
43.4 |
56.6 |
42.6 |
|
Dallas |
1,398,469 |
54,553 |
33.9 |
66.1 |
39.9 |
|
Tarrant |
1,212,524 |
68,466 |
50.0 |
50.0 |
28.5 |
|
Bexar |
1,189,373 |
118,109 |
40.8 |
59.2 |
60.0 |
|
Travis |
854,577 |
68,466 |
27.0 |
73.0 |
33.9 |
|
Total 5 Counties |
7,135,465 |
449,751 |
40.2 |
59.8 |
41.0 |
The political muscle of communities with colleges and universities has been documented by other analysts as well. In past presidential elections, counties with flagship higher education institutions have increasingly swung toward Democrats. According to a recent analysis of 2020 election results by The Chronicle of Higher Education, Trump carried 87 of the 136 counties in five states that flipped from Trump in 2016 to Biden in 2020 (Arizona, Georgia, Michigan, Pennsylvania and Wisconsin) that included four-year public or private nonprofit colleges with at least 100 students. Biden carried only 49 of these counties according to unofficial results. How did Biden manage to flip these five states? As explained by the reporter analyzing this outcome:
“But Biden’s counties were more populous: They produced 12.7 million total votes, more than double the 5.4 million votes that came from the counties with colleges in them that Trump won. Biden’s counties, while smaller in number, also had more colleges in them: 191 to 138 in Trump’s counties.” (page 2) [21]
Thus, Trump’s advantage of capturing more counties was overcome by Biden’s advantage of capturing fewer counties with substantially more voters.
Did Weak Support in South Texas Cause Joe Biden to Lose Texas?
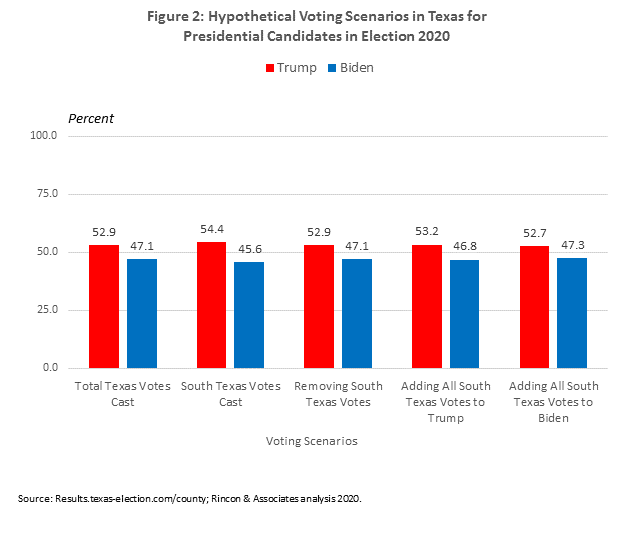
Some of the news stories suggested that Joe Biden had lost the Texas vote to Trump due to weak Latino support in South Texas compared to the support previously enjoyed by Hillary Clinton in 2016. To address this issue, we conducted three hypothetical analyses to evaluate how the statewide voting outcomes for Donald Trump and Joe Biden would change under the following three scenarios:
· Scenario 1: All of the votes cast by South Texas were removed from the total votes cast in Texas
· Scenario 2: All of the South Texas votes were cast in favor of Donald Trump
· Scenario 3: All of the South Texas votes were cast in favor of Joe Biden
Table 8 below presents the calculations used to evaluate these three scenarios.
Table 8: Hypothetical Voting Scenarios for Presidential Vote in Texas
|
Scenario |
Trump |
Biden |
Total |
|
Total Texas Votes Cast |
5,860,096 |
5,211,406 |
11,071,502 |
|
Percent |
52.9 |
47.1 |
100.0 |
|
South Texas Votes Cast |
29,270 |
24,537 |
53,807 |
|
Percent |
54.4 |
45.6 |
100.0 |
|
Scenario 1: Removing South Texas Votes |
5,830,826 |
5,186,869 |
11,017,695 |
|
Adjusted Percent |
52.9 |
47.1 |
100.0 |
|
Scenario 2: Adding All South Texas Votes to Trump |
5,884,633 |
5,186,869 |
11,071,502 |
|
Adjusted Percent |
53.2 |
46.8 |
100.0 |
|
Scenario 3: Adding All South Texas Votes to Biden |
5,870,826 |
5,240,676 |
11,071,502 |
|
Adjusted Percent |
52.7 |
47.3 |
100.0 |
|
Source: Results.texas-election.com/county; Rincon & Associates Analysis, 2020 |
|||
Using the percentages for each scenario in Table 8, Figure 2 below clearly illustrates that under each scenario, Donald Trump still wins the Texas vote. Thus, the votes from South Texas – regardless of whether they were totally removed or changed to votes for Trump or Biden – would not have changed the final Texas vote outcome for the presidential candidates.
How much confidence can we place on Hispanic polling results?
As final food for thought, it is helpful to weigh in the insights from The New York Times polling expert – Nate Cohn – who recently shared his post-mortem of the 2020 election in an op-ed entitled “What went wrong with polling? Some early theories.” Of particular relevance are his conclusions about the extent to which 2020 polling errors were influenced by Hispanic voters. The following comments are paraphrased from his narrative:
“What appeared in Miami-Dade was not just about Cuban-Americans. Although Democrats flipped a Senate seat and are leading the presidential race in Arizona, Mr. Trump made huge gains in many Hispanic communities across the country…Many national surveys don’t release results for Hispanic voters because any given survey usually has only a small sample of this group….But if the Florida polls are any indication, it’s at least possible that national surveys missed Mr. Trump’s strength among Hispanic voters. It seems entirely possible that the polls could have missed by 10 points among the group. If true, it would account for a modest but significant part – maybe one-fourth – of the national polling error.” (p. 6) [22]
Mr. Cohn’s assessment may have merit regarding pollsters who only occasionally conduct polls of U.S. Hispanics and thus more likely to include common sources of bias in studies of this population segment. However, the results of polls of U.S. Hispanics conducted by more experienced pollsters of Hispanics – such as Latino Decisions and Pew Research Center — often include larger samples and were more closely aligned with the results of exit polls conducted by CNN — resulting perhaps in less polling error. In our recent publication, “The Culture of Research,” [23] we discuss the following common sources of bias that are observed in surveys of multicultural populations:
· Identity Bias: The use of vague, outdated or offensive race-ethnic labels that lead to over-counts or under-counts of respondents, or just missing data.
· Coverage Bias: The use of sampling frames that exclude Hispanics, immigrants, the lower income and non-English speakers.
· Sampling Bias: Selecting samples of respondents that do not represent the population of interest, often by using non-random samples, small samples or sampling high density areas populated by Blacks, Hispanics or Asians.
· Mode Bias: Providing survey respondents only one mode (i.e., telephone, online or mail) to complete a survey which can exclude persons with vision, hearing or speaking impairments, lower literacy skills, or no Internet access.
· Language Bias: Providing English-only surveys or poorly translated surveys to Hispanic and Asian immigrants lowers response rates and response quality since immigrants prefer native language surveys that are accurately translated.
· Weighting Bias: Distorted statistical indicators can result from the failure to apply weights to correct survey sample imbalances or using weights that are outdated.
We agree with Mr. Cohen that greater polling error can occur in studies that include Hispanic populations, although we would add that such errors are more likely to occur in polls conducted by companies that do not have a strong track record for conducting studies of U.S. Hispanics.
Conclusion
Although the final 2020 election results with detailed demographic information will not be available for several months, there are some general conclusions that we can make given the information reviewed thus far:
· Joe Biden did not lose Texas due to weak support from South Texas Latinos but rather the limited political resources in the region.
· Latino voters were highly engaged to vote in the 2020 election as determined by pre-election polls.[24]
· Despite the threat of COVID-19 and numerous voter suppression tactics by the Republican Party, Latinos turned out to vote in historic numbers.
· Latinos were responsive to the message strategies of both campaigns, whether the message was accurate or fabricated. Latino Trumpers in Florida and Texas appeared more trusting and easier to mislead with false information.
· Latinos revealed stronger support for Joe Biden than Donald Trump in Texas, Florida and Arizona, although stronger than expected Latino support was observed for Donald Trump.
· Joe Biden revealed stronger support among Hispanic women, the college-educated, and those living in large urban areas. Donald Trump showed stronger support from Hispanic males who were not college educated and lived in smaller urban and rural communities.
· There is reason to believe that national pollsters experienced more errors when measuring the sentiments of Hispanic voters, although more confidence was proposed for pollsters with a stronger track record in polling the Hispanic population and using higher standards.
End Notes
[1] CNN Exit Polls (2020, November 11). Accessed at: https://www.cnn.com/election/2020/exit-polls/president/national-results/0
[2] Solis, D., Corchado, A., Morris, A., and Cobler, P. (2020, November 6). With the Latino vote up for grabs, how did Trump make inroads in South Texas? The Dallas Morning News. Accessed at: https://www.dallasnews.com/news/politics/2020/11/06/latino-vote-up-for-grabs-as-trump-makes-inroads-in-south-texas/
[3] Garrett, R.T. and Hacker, H.K. (2020, November 4). Dark alley no more: This time, Texas Republicans were ready for the Democrats. Dallas Morning News. Accessed at https://www.dallasnews.com/news/elections/2020/11/04/dark-alley-no-more-this-time-texas-republicans-were-ready-for-the-democrats/
[4] Ibid.
[5] Medina, J. (2020, October 19). The macho appeal of Donald Trump. New York Times. Accessed at https://www.nytimes.com/2020/10/14/us/politics/trump-macho-appeal.html
[6] Chavez, N. (2020, November 9). ‘There’s no such thing as the Latino vote.’ 2020 results reveal a complex electorate. CNN, Accessed at: https://www.cnn.com/2020/11/09/politics/latino-voters-florida-texas-arizona/index.html
[7] Ibid, 2. Solis, D., Corchado, A., Morris, A., and Cobler, P. (2020, November 6). With the Latino vote up for grabs, how did Trump make inroads in South Texas?
[8] Comptroller.Texas.Gov. (2020, November 6). The South Texas Region 2020 Regional Report. Texas State Comptroller, Accessed at: https://comptroller.texas.gov/economy/economic-data/regions/south.php
[9] Peacock, B. (2020, May 11). Renewable energy booming in Texas as oil and gas struggles. The Texan. Accessed at: https://thetexan.news/renewable-energy-booming-in-texas-as-oil-and-gas-struggles/#:~:text=EnergyIssuesRenewable%20Energy%20Booming%20in%20Texas%20as%20Oil%20and%20Gas%20Struggles&text=Solar%20energy%20also%20reached%20its,is%20down%20over%2010%20percent.
[10] Jatlaoui, T.C. Eckhaus, L., and Mandel, M.G. (2019, November 29). Abortion Surveillance – United States 2016. MMWR Surveill Summ 2018; 68 (No. SS-11: 1-41. Accessed at: https://www.cdc.gov/mmwr/volumes/68/ss/ss6811a1.htm
[11] Korzenny and Korzenny, ( ). Hispanic marketing.
[12] Hancı, F. (2019, July 22). Hate crimes increase in the US since Trump’s election. Politics Today, Accessed at https://politicstoday.org/hate-crimes-increase-in-the-us-since-trumps-election/
[13] Brooks, B. (2019, November 12). Victims of anti-Latino hate crimes soar in U.S.: FBI report. Reuters. Accessed at https://www.reuters.com/article/us-hatecrimes-report/victims-of-anti-latino-hate-crimes-soar-in-u-s-fbi-report-idUSKBN1XM2OQ
[14] Anderson, K.B. (2013, April). Consumer Fraud in the United States, 2011 The Third FTC Survey, Federal Trade Commission, Accessed at: https://www.ftc.gov/sites/default/files/documents/reports/consumer-fraud-united-states-2011-third-ftc-survey/130419fraudsurvey_0.pdf
[15] Ibid 8, The South Texas Region 2020 Regional Report.
[16] Ibid 1, CNN Exit polls in Texas.
[17] Barreto, M. (2016, November 10). Lies, damn lies and exit polls. Latino Decisions. Retrieved from http://www.latinodecisions.com/blog/2016/11/10/lies-damn-lies-and-exit-polls/
[18] Ibid 3, Dark alley no more: This time, Texas Republicans were ready for the Democrats.
[19] Krogstad, J.M. and Lopez, M.H. (2020, October 16). Latino voters have growing confidence on Biden key issues, while confidence in Trump remains low. Pew Research Center, Accessed at: https://www.pewresearch.org/fact-tank/2020/10/16/latino-voters-have-growing-confidence-in-biden-on-key-issues-while-confidence-in-trump-remains-low/
[20] Ibid 8, The South Texas Region 2020 Regional Report.
[21] June, A.W. (2020, November 15). How higher ed helped flip 5 states in the 2020 election. The Chronicle of Higher Education. Accessed at https://www.chronicle.com/article/how-higher-ed-helped-flip-5-states-in-the-2020-election
[22] Cohn, N. (2020, November 10). What went wrong with polling? Some early theories. The New York Times – Upshot. Accessed at https://www.nytimes.com/2020/11/10/upshot/polls-what-went-wrong.html
[23] Rincon, E.T. (2020, August 20). The Culture of Research. The Writer’s Marq, Dallas, Texas.
[24] Pantoja, A. (2020, November 2). Latino voters are ready to deliver a decisive victory to Biden and the Democrats. Latino Decisions. Accessed at: https://latinodecisions.com/blog/latino-voters-are-ready-to-deliver-a-decisive-victory-to-biden-and-the-democrats/?utm_medium=email&utm_campaign=New%20From%20Latino%20Decisions%20-%20title%202020-11-03%20103850&utm_content=New%20From%20Latino%20Decisions%20-%20title%202020-11-03%20103850+CID_48c4eeda4a81e8820521b83dcf471e94&utm_source=Email%20marketing%20software&utm_term=Latino%20Voters%20Are%20Ready%20to%20Deliver%20a%20Decisive%20Victory%20to%20Biden%20and%20the%20Democrats%20Adrian%20Pantoja%20%20November%202%202020
