
Does Unconscious Bias Explain Police Brutality?

National and global attention has shown a spotlight on the brutal killing of George Floyd – an unarmed black man who died when Officer Derek Chauvin pressed his knee against Floyd’s neck for an estimated eight minutes and 45 seconds while other officers looked on without intervening.  Although Officer Chauvin has been charged with second degree murder, protests continue to advocate for police reforms to stop these needless killings.  Indeed, the historical record reveals that law enforcement throughout the U.S. has all but declared open season on Black males. For example, a Tulsa Police Department Division Commander, Major Travis Yates, recently explained that African Americans probably ought to be shot more often based on the amount of contact that they have with the police.[i]
In the ensuing debates about police reforms, unconscious bias training has emerged as one potential strategy. But what is “unconscious bias”?   Following is one simple definition:

Unconscious biases, also known as implicit biases, are the underlying attitudes and stereotypes that people unconsciously attribute to another person or group of people that affect how they understand and engage with a person or group.”  [ii]

The key term here is “underlying” which suggests that the individual may not be aware of these attitudes and stereotypes.  For example, gender bias is the tendency to prefer one gender over another gender.  Confirmation bias is the inclination to draw conclusions about a situation or person based on your personal desires, beliefs and prejudices rather than on unbiased merit.  Although there are different types of unconscious bias, they share one thing in common:  a lack of awareness or consciousness by the individual who may later choose to act on these beliefs.
Regardless of the type of unconscious bias under consideration, I do not buy the argument that people are not conscious of their “underlying” attitudes and stereotypes – as if their behavior deserves to be forgiven or not disciplined due to an alleged lapse in memory or consciousness.  The following three examples will hopefully make my point.
  
Training Police on Using Pepper Spray
A news article in The Dallas Morning News described an unusual training program at the Cambridge police academy on the appropriate use of pepper spray when apprehending Mexican American suspects. [iii]  Police academy trainers were instructing new cadets to use stronger doses of pepper spray on Mexican American suspects. Officer Gutoski, the department training officer, explained their rationale in rather un-scientific terms: “Mexicans grow up eating too much spicy food, and because they spend so much time picking hot peppers in the fields….so with Cajuns, Mexican-Americans, Pakistani, Indian…what happens is that pepper spray is effective for a much shorter time.”  Even more unnerving is the explanation by departmental spokesman, Frank Pasquarello, that “Officer Gutoski was repeating information that’s shared all the time among officers in informal training sessions on the use of pepper spray.”   The training program might have been considered an act of “unconscious bias” if not for the fact that it was part of the approved training program.
Is Racial Profiling on the Decline?
A recent analysis of traffic stops made by the Texas Highway Patrol revealed that racial profiling of Hispanics was on the decline, although critics suspected that the Department of Public Safety was deliberately misclassifying Texas drivers that they stopped in order to lower the state’s racial profiling statistics. [iv] Further analysis, however, revealed that the DPS troopers were assigning the race category based on the physical characteristics of the drivers, rather than simply asking each driver to identify themselves by race or ethnicity. To achieve the lower racial profiling statistics, troopers apparently found it convenient to classify Hispanic drivers as white. Was this unconscious bias?  Perhaps not since the misclassifications by race-ethnicity were not random and designed to achieve one objective:  to lower the racial profiling statistics in Texas.
Just a Cup of Coffee

A Starbucks shop in Pennsylvania received national attention regarding the mistreatment of two Black men who were asked to leave the premises even though they were just waiting for a meeting to take place.  The Starbucks manger called police to remove the two men from the premises.  The CEO of Starbucks wasted little time in personally apologizing to the two black men for their discriminatory treatment and announced that all Starbucks employees would be required to attend a workshop to identify and remediate unconscious bias.
In my view, the Starbucks manager in Philadelphia that requested police action to remove the two black customers was not motivated by “unconscious bias,” but rather by conscious beliefs and prejudices against blacks that were not detected in the screening process by Starbucks staff.  While it is common practice for organizations to screen applicants for job skills, personality, career and criminal background, it seems that screening for beliefs and attitudes about blacks and Latinos should also be part of the hiring process.  
Does cultural knowledge or awareness influence medical treatment?

One recent study explored the trend in pain management wherein whites were more likely than Blacks to be prescribed strong pain medications for equivalent treatments.[v]  Researchers at the University of Virginia quizzed white medical students and residents to learn how many believed inaccurate statements about biological differences between the two races – such as “black people’s blood coagulates more quickly,” “Blacks’ skin is thicker than whites’,” and “Blacks’ nerve endings are less sensitive than whites.’ ” Although they expected some endorsement of these statements, the investigators were surprised that so many in the group with medical training endorsed such beliefs. It was discovered that those who held false beliefs often rated Black patients’ pain lower than that of white patients and made less appropriate recommendations for the treatment of their pain. 
Does Unconscious Bias Help Us Understand Police Brutality?
It is not likely that Officer Chauvin experienced unconscious bias while he forced his knee on Floyd’s neck for eight minutes and 45 seconds.  It is more likely, based on his past behavior, that he intentionally and consciously killed Floyd.  Officer Chauvin should have been removed from policing a long time ago, and it is not likely that any amount of unconscious bias training could have changed his animosity towards blacks. Such individuals pose a danger to the safety of all residents, especially people of color.
Beliefs, prejudices or stereotypes about people of color are a consequence of many factors – family values, a past negative experience, media stereotypes, and growing racial segregation in residences, churches, schools, and social networks – factors that are very resistant to change. In addition, the current political climate in the U.S. has “normalized” racist commentary and behaviors towards blacks and Latinos, making it much easier to mistreat these groups.  In 2018, there were 7,120 hate crime incidents in the U.S. with a majority of the reported hate crimes motivated by race, ethnicity or ancestry bias (59.6 percent). [vi]  (See Figure 1 below)

Figure 1

Conclusion
  The prevalence of hate crimes based on race, ethnicity or ancestry should serve as a loud warning bell to employers that current employees and new hires, especially armed police officers, should be vigorously investigated for past experiences and current attitudes related to people of color. Once the presence of these negative attitudes or stereotypes is confirmed, these individuals should not be hired. Current employees should be removed from the organization or re-assigned to a position that does not require interaction with the public. Indeed, it is insufficient to simply conclude that a person shows evidence of unconscious bias that is potentially harmful and expect that a workshop will magically remediate their hostility towards Blacks, Latinos or Asians.  
End Notes

[i] Li, D.K.   (2020, June 11).  African Americans ‘probably ought to be’ shot more by police, a top Tulsa officer said. NBC News. Accessed at https://www.nbcnews.com/news/us-news/african-americans-probably-ought-be-shot-more-police-top-tulsa-n1229981
[iii] Dallas Morning News (1999, August 14).  Pepper spray remarks backfire on department. Cited from  Los Angeles Times.
[iv] Rincón, E. T. (2016). How DPS can improve its system of recording race/ethnicity during traffic stops.  Dallas News, Jan. 2016. Available at https://www.dallasnews.com/opinion/commentary/2016/01/27/edward-t.-rincon-how-dps-can-improve-its-system-of-recording-raceethnicity-during-traffic-stops
[v] Hoffman, K.M., Trawalter, S., Axt, J.R., and Oliver, M.N.(2016, April 19).  Racial bias in pain assessment and treatment recommendations, and false beliefs about biological differences between blacks and whites.  PNAS Vol. 113 No. 16.

[vi]  McCarthy, N. (2019, November 13).  U.S. Hate Crimes Remain At Heightened Levels. Statistica. Accessed at https://www.statista.com/chart/16100/total-number-of-hate-crime-incidents-recorded-by-the-fbi/

Missing Race-Ethnicity Data Complicates Covid-19 Mortality Counts, But the Solution is Simple

Recent news reports about mortality counts for the Coronavirus point to the potential of large under-counts due to the exclusion of deaths occurring at homes and the classification of causes of death in the frenzied environment of so many deaths occurring in communities. [i]

In addition, national reviews are showing that black mortality rates are much higher – sometimes twice as much – as their representation in the population for several communities such as Michigan, Illinois, North Carolina and South Carolina. [ii] Relatively less information has been provided in national news reports regarding mortality rates for Latinos.    
Recognizing these racial disparities, elected officials in Texas are pressing Governor Greg Abbot to form an emergency task force to evaluate racial disparities surrounding the coronavirus pandemic since several Texas cities are reporting that the disease is disproportionately affecting black residents. [iii]  Large gaps in data collection, however, exist at the county and state level, meaning that the full picture is unclear.  In response to these concerns, the Governor’s office offered no comment and continues its policy of not mandating the collection of this critical information.  As the Texas elected officials emphasized, the demographic data regarding Covid-19 mortalities is needed to guide resources to the more vulnerable communities or “hot spots” in the state.
Unfortunately, accurate estimates of Covid-19 mortality rates by race-ethnicity are systematically under-estimated because so many of the deaths are not being classified by race-ethnicity.  The absence of race-ethnic data undermines the planning of intervention strategies since it is fairly well understood that identifying clusters of infected persons can expedite a quick intervention and solution to the spread of the virus.
Thus far, the knowledge that blacks have higher Covid-19 mortality rates compared to their population in a community has been attributed to the confluence of co-morbidities like diabetes, high blood pressure, obesity, and higher prevalence of cardiovascular disease. Less attention has been devoted, however, to the influence of social determinants of health – that is, black people tend to live in poor areas that include poor access to healthy foods and healthcare providers.[iv] There could be other correlates that are equally important in explaining these high mortality rates, such as lack of knowledge about the virus, negative attitudes towards healthcare providers, religious beliefs, fear of family separation, and other psychological factors.

An Important Question to Ponder
Given the gravity of the high mortality rates among blacks and Hispanics, and the real possibility that they could be higher and likely to spread the virus more rapidly in these vulnerable communities, why have public officials not mandated the collection of race-ethnic information for Covid-19 infected persons and mortalities?   
Thus far, the explanations appear to rest on the assumption or belief that the sheer volume of mortalities does not allow sufficient time to demographically classify the corpses.  While this theory may be true, following are a few examples from my research practice that illustrate the consequences of policies that utilize inaccurate race-ethnic information or appear indifferent to its inclusion. In general, the solutions were not complicated nor time consuming.

Is Racial Profiling on the Decline?:
A recent analysis of traffic stops made by the Texas Highway Patrol revealed that racial profiling of Hispanics was on the decline, although critics suspected that the Department of Public Safety (DPS) was deliberately misclassifying Texas drivers that they stopped in order to lower the state’s racial profiling statistics. [v]  Further analysis, however, revealed that the DPS troopers were assigning the race category based on the physical characteristics of the drivers. For example, by classifying Hispanic drivers as “white,” the racial profiling statistics were systematically lowered in the State of Texas. The recommended solution was to simply ask each driver to self-identify their race or ethnicity by choosing from a card with standard race-ethnic categories that could be presented by the DPS trooper. [vi] 

Relying on Surnames:  A Legal Matter
In a Dallas County murder trial that engaged me as an expert witness, the defense attorney had requested a change of venue because he felt that a fair trial was not possible for his Hispanic client. Why? Because the share of Hispanics in the jury pool was likely to be substantially different from the Hispanic share of the county’s population. I was asked to conduct a statistical analysis to address this issue; however, the race-ethnic information recorded by the court for jury pool members was considered unreliable for the analysis because it was inconsistently recorded. A surname was the only information available to estimate the Hispanic ethnicity of jury pool members at an estimated accuracy of 75 percent.  A change of venue was justified since the estimate of Hispanics in the jury pool was not reflective of their representation in the County’s population.  Clearly, a different legal outcome might have resulted if the venue had not changed.

The Mystery Surrounding the Causes of Asian Mortalities
Information about the leading causes of mortality among Asian American subgroups have been few in epidemiological studies because (a) only seven states collected Asian subgroup information on death records before 2003, (b) coroners were more likely to make race-ethnic classification errors for Asian Americans (13%) and Hispanics (7%) and (c) national health surveys did not report data for Asian American subgroups. [vii] As a result, misleading and erroneous conclusions were often made due to the omission of Asian respondents resulting from small sample sizes, or the aggregation of data that masked important differences among the Asian subgroups. For example:
·       Asian Indians have greater coronary heart disease risk than Chinese persons when compared to non-Hispanic whites;
·       Japanese have greater risk for incident cancers while Asian Indians have the lowest risk;
·       Liver cancer mortality rates are higher for Vietnamese, Koreans and Chinese when compared to other Asian American subgroups and non-Hispanic whites.
·       Colorectal cancer rates are particularly higher for Japanese and exceed the rates for non-Hispanic whites and all other Asian subgroups.
The study investigators also discussed the results of recent pharmacogenomics studies that document how some Asian American subgroups respond differently to a variety of drug treatments, including chemotherapy, anti-coagulants, anti-platelets, and anticonvulsants. The inclusion of Asian subgroup categories in major health surveys and in the processing of medical information has greatly expanded medical knowledge and treatment related to Asian subgroups.  At least in the medical arena, the study investigators clearly illustrated that carelessness or indifference to the use of Asian subgroup identities can have significant consequences. 
Thus, it should be obvious that missing or inaccurate race-ethnic information can have serious consequences to our quality of life and should not be dismissed so easily by public officials who believe that it requires a great investment of time.

Current Technology Points to a Simple Solution for the Covid-19
In the absence of information regarding the race-ethnic background of a given population, we can take comfort in knowing that it is now possible to classify the race-ethnic background of an individual based on their first name, last name and their residential zip code.  Ethnic Technologies developed a proprietary classification system called E-Tech 2020 [viii] which has been utilized in several survey studies that I have conducted in past years.  In one national study of black, Latino and Asian consumers in the U.S., race-ethnicity information was missing and presented a major barrier to the sample design and planning of the survey.  The E-Tech tool was used to estimate a race-ethnic category in a database of 200,000 household addresses that allowed us to plan the appropriate language for the questionnaires and manage a team of telephone interviewers with the relevant language skills.  The completed surveys that we received confirmed that the accuracy of the assigned race-ethnic category using the E-Tech tool was 80-90 percent when compared to the self-reported race-ethnicity of the survey respondents.  Self-identification has usually been found to be a more valid measure of a person’s race and ethnicity, while surname and language preference have also been used although considered less valid measures. [ix]  In a more recent review and analysis using geo-coding and surnames to estimate race and ethnicity, the investigators concluded that the combined approach can yield positive predictive values of 80 percent, thereby offering a viable means for assigning race and ethnicity for the purpose of examining disparities in care until self-reported data can be systematically collected. [x] While not a perfect measure, the E-Tech tool has been shown to be quite useful in my past research experience.
What is the relevance of the E-Tech tool for the Covid-19 situation?  Simply, it can drastically reduce the amount of time needed to identify the likely race-ethnic categories for a listing of mortalities that includes their names and addresses.  Moreover, the E-Tech tool is affordable and likely to fit most public agency budgets.  By using this service, public officials could more readily identify clusters of vulnerable populations, such as blacks and Latinos, that require immediate intervention to minimize the spread of the coronavirus.  While the accuracy of the E-Tech tool in estimating a person’s race-ethnic classification is not 100 percent, it nevertheless presents a significant advantage over the current system of delays and backlogs that are typical in public agencies.  
I challenge Gov. Abbott and other public officials to mandate the classification of race-ethnicity for all Covid-19 infections and mortalities using the E-Tech tool or perhaps another service that accomplishes similar results. Indeed, this action would illustrate true leadership in our collective efforts to stop the threat of this deadly virus.


Reference Notes


[i] Gillum, J., Song, L. and Kao, J.  (2020, April 14).  There’s been a spike in people dying at home in several cities. That suggests coronavirus deaths are higher than reported.  Accessed on 4-15-20 at https://www.propublica.org/article/theres-been-a-spike-in-people-dying-at-home-in-several-cities-that-suggests-coronavirus-deaths-are-higher-than-reported
[ii] Ray, R.  (2020, April 9).    Why are Blacks dying at higher rates from COVID-19?  The Brookings Institution. Accessed on 5-15-20 at https://www.brookings.edu/blog/fixgov/2020/04/09/why-are-blacks-dying-at-higher-rates-from-covid-19/
[iii] Morris, A.  (2020, April 14).  Texas elected officials push for emergency response to racial disparities emerging in Covid-19 pandemic.  The Dallas Morning News, accessed on 4-14-20 at https://www.dallasnews.com/news/public-health/2020/04/14/texas-elected-officials-push-for-emergency-response-to-racial-disparities-emerging-in-covid-19-pandemic/
[iv] Yancy, C.W. (2020, April 15). Covid-19 and African Americans. JAMA Network. Access on 4-15-20 at https://jamanetwork.com/journals/jama/fullarticle/2764789
[v] Rincón, E. T. (2016). How DPS can improve its system of recording race/ethnicity during traffic stops.  Dallas News, Jan. 2016. Available at https://www.dallasnews.com/opinion/commentary/2016/01/27/edward-t.-rincon-how-dps-can-improve-its-system-of-recording-raceethnicity-during-traffic-stops
[vi] Ibid.
[vii] Holland, A.T. & Palaniappan, L.P. (2012, June 22). Problems in the collection and interpretation of Asian-American health data: Omission, aggregation, and extrapolation.  Ann. Epidemiol. 2(6).
[viii]Ethnic Technologies, accessed on 4-16-20 at  https://www.ethnictechnologies.com/.
[ix]Rincón, E. T. (in press).  The Culture of Research, Writers Marq, Dallas, Texas.
(x)  Fiscella, K. and Fremont, A.M. (2006).  Use of geocoding and surname analysis to estimate race and ethnicity. Health Services Research, 41-4, Part I. Access on 4-17-20 at https://www.ncbi.nlm.nih.gov/pmc/articles/PMC1797082  

Undermining the 2020 Census: Trump’s Toxic Brew of Crime, Hysteria and Immigrants

In a recent news story, The New York Times tells us that the Trump administration is sending elite tactical Border Patrol teams (BORTRAC) to sanctuary cities that “release dangerous criminal aliens to prey upon the public.” [i]  Sanctuary cities are targeted because local officials have refused to provide  support to ICE in enforcing immigration policies that are perceived as pushing undocumented people further into the shadows, making cities less safe as immigrant become less likely to report crimes or cooperate with investigations.
These BORTAC agents are accustomed to engaging in armed confrontations with drug-smuggling suspects using armored vehicles. They act as the SWAT team of the Border Patrol using such gear as stun grenades and enhanced Special Forces-type training. The officers usually target individuals who are known to be violent with extensive criminal records. Local officials have voiced concerns about the increased militarizing of their communities that could also have deadly consequences. The interventions also result in “collateral arrests” involving innocent family members.    
   
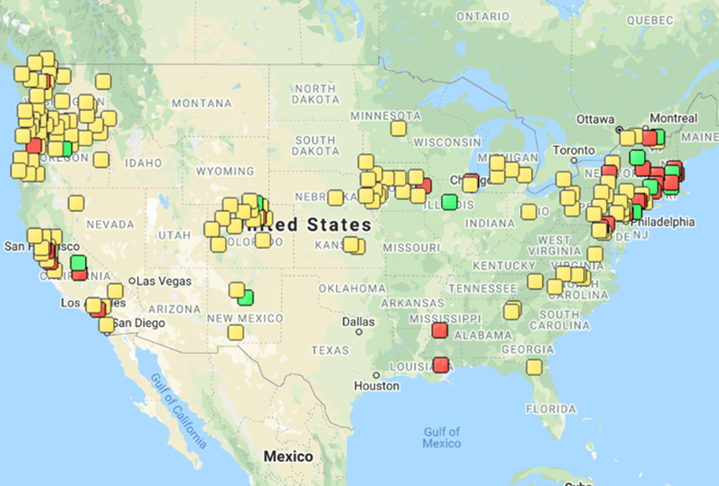
This terror campaign against sanctuary cities is broad in its scope and includes large cities like Chicago, New York, San Francisco, Los Angeles, Atlanta, Houston, Boston, New Orleans, Detroit and Newark, N.J. The map[ii]below, produced by The Center for Immigration Studies, shows the current distribution of sanctuary counties (yellow), cities (red) and states (green) throughout the U.S.  Importantly, there are many communities throughout the U.S. with substantial numbers of immigrants that are not sanctuaries and thus excluded from this map.
Figure 1: Distribution of Sanctuary Cities, Counties and States, 2020
Source:  Center for Immigration Studies, February 2020.

Interestingly, it is no coincidence that the BORTRAC agents are being deployed from February  through May of this year – the same period of time that the 2020 Census is being conducted.   Previously, the Trump administration also worked feverishly to include a citizenship question in the 2020 Census questionnaire which was rejected by the courts due to its potential to discourage response rates of the nation’s immigrant population. Similarly, the deployment of BORTRAC agents is designed to create fear and anxiety among immigrants in sanctuary cities that is likely to discourage participation in the 2020 Census. 
Why does this matter?  Because access to millions of federal dollars by cities throughout the nation are jeopardized by a Census under-count – funds that are used to support schools, hospitals, roads and highways, and other infrastructure needs. The irony is that a Census under-count will impact not just sanctuary cities, but many communities with substantial immigrant populations that are not sanctuaries.  For example, Dallas County is not included in the list of sanctuary counties, but it is estimated that $40 million in federal funds will be lost for every 1 percent drop in the Census response rate. [i]

To justify this reign of terror, the Trump administration explains that the elite agents will assist the targeted communities in handling “dangerous criminal illegal aliens” that are being protected by sanctuary cities. The facts about immigrant crime, however, have established over numerous studies that immigrants do not increase local crime rates, are less likely to cause crime and less likely to be incarcerated than their native-born peers – important facts that were included in a recent review by The Cato Institute regarding immigrant crime rates in the U.S. and the State of Texas. [ii]  In their in-depth analysis of data from the Texas Department of Public Safety, Institute investigators analyzed the arrests and convictions for the year 2015 to determine the extent to which different crimes were conducted by illegal immigrants, legal immigrants and the native born.  The conclusion from their analysis, quoted below, provides concrete evidence that the Trump narrative about “dangerous criminal aliens” is false and misguided:
“The homicide conviction rate for illegal immigrants was 16 percent below that of native-born Americans in Texas in 2015. The conviction rates for illegal immigrants were 7.9 percent and 77 percent below that for native-born Americans for sex crimes and larceny, respectively.  For all criminal convictions in Texas in 2015, illegal immigrants had a criminal conviction rate 50 percent below that of native-born Americans.  Legal immigrants had a criminal conviction rate 66 percent below that of native-born Americans.”  (p.5)
Crime, therefore, is merely a pretext for justifying the deployment of BORTRAC agents in sanctuary communities – a pretentious show of force whose only purpose is to discourage participation of immigrants in the 2020 Census and enhance the political positioning of the Republican party.
Also lost in the campaign to target sanctuary cities are the substantial contributions made by immigrants,  both legal and undocumented, to the U.S. economy, the defense of our nation in times of war, the many patents for inventions at U.S. academic institutions, keeping the Social Security system solvent, and the numerous jobs created by entrepreneurs. [iii]
The Trump administration and the GOP have demonstrated an uncanny ability of fortifying their political power by implementing draconian policies that punish immigrant families and the public entities that value and support immigrants. I am hopeful, nonetheless, that the supportive network of sanctuary cities, counties and states will remain steadfast in their support and maintain careful vigilance over the newly deployed tactical agents to discourage the use of aggressive or violent behavior towards immigrant residents. Non-sanctuary cities should be equally concerned about the potential loss of federal dollars in their communities as well since the deployment of BORTRAC agents will be communicated by news media throughout the nation.
In the meantime, the Census Bureau will be doubly challenged to ensure an accurate count in the 2020 Census as Trump’s elite forces are deployed in the sanctuary cities. To minimize potential confrontations with ICE and Trump’s elite forces, perhaps immigrants should be strongly encouraged to complete the online version of the Census questionnaire on their smart phones, home computers or other devices. Trump should not be handed a victory by allowing his elite forces to suppress Census participation, depriving communities of important federal funds, and shaping the balance of political representation.
U.S. residents should realize that when immigrants lose, we all lose.       

Reference Notes

[i] Dallas County, Texas (2018). Request for Proposal for 2020 Census Participation Initiative for Dallas County, Page 21.
[ii] Nowrasteh, A. (2018).  Criminal immigrants in Texas:  Illegal immigrant conviction and arrest rates for homicide, sex crimes, larceny, and other crimes. Immigration Research and Policy Brief No. 4, The Cato Institute. Accessed at https://www.cato.org/publications/immigration-research-policy-brief/criminal-immigrants-texas-illegal-immigrant
[iii] Rincón, E. T. (2017). Sanctuary city politics:  Wolves in sheep’s clothing.  TribTalk – Perspectives on Texas. A Publication of the Texas Tribune.  Accessed at https://www.tribtalk.org/2017/02/13/sanctuary-city-politics-wolves-in-sheeps-clothing/


[i]Dickerson, C. and Kanno-Youngs, Z. (2020).  Border Patrol will deploy elite tactical agents to sanctuary cities. The New York Times, accessed at https://www.nytimes.com/2020/02/14/us/Border-Patrol-ICE-Sanctuary-Cities.html
[ii]Griffin, B. and Vaughan, J.S. (2020). Center for Immigration Studies, accessed at https://cis.org/Map-Sanctuary-Cities-Counties-and-States

What hurts South Dallas more – crime or the hasty reporting of crime?

A recent headline in The Dallas Morning News sent its readers a chilling message: “Dallas has had 200 murders in 2019. Here’s what that means.” [i] It reminded everyone of the unfortunate consequences of urban growth and the absence of sensible gun control. With 40 homicides recorded for the month of May according to news reports,[ii] Chief of Police Hall requested that Gov. Gregg Abbott send state troopers to assist the under-staffed Dallas Police Department to help control the alarming rise in homicides.[iii] 

Although few specifics were provided on the type of support that the state troopers provided,[iv] news reports indicated that it was focused on the South Dallas community, that community residents felt that the troopers presence did more harm than good and created a sense of distrust.[v] This sense of distrust of DPS troopers was underscored by the slaying of a black resident in South Dallas who was stopped for failing to signal a turn.[vi] Although conflicting reports emerged about whether the victim had drawn a gun or not, the Texas Department of Public Safety declined to release video footage of the incident, and the two state troopers were not indicted for the incident.  The victim had been shot 16 times by the state troopers – five times in the front and four times in the back of his torso according to the autopsy report.

This is not the first time that South Dallas has been singled out in reports related to increased crime.  Interestingly, the Dallas Morning News story further explained that the “majority of homicides occurred in South Dallas zip codes” but did not provide its readers any detailed crime statistics to support this conclusion.[vii]
Adding fuel to the fire was a recent study of South Dallas published in Urban Science [viii]by two social scientists who concluded that “South Dallas is safer than only 13% of the cities in Texas and there is a 1 in 17 chance of becoming a victim of any crime.”
In providing such a disparaging picture of South Dallas, one would hope that journalists and social scientists are doing their due diligence in analyzing crime data.  Unfortunately, that is not always the case.  
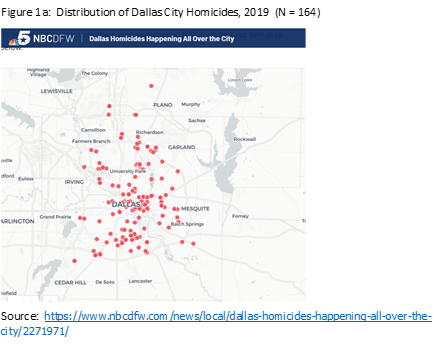
Indeed, other independent analyses provide a different picture of crime in South Dallas. For example, D Magazine[ix][x] and NBC 5[xi] recently released news stories that addressed the pattern of homicides by including a map of City of Dallas 2019 homicides produced by Robert Mundinger (www.themap.net). According to these stories, homicides were “pretty much everywhere.” Figure 1a below displays the map of homicides included in the NBC 5 story which illustrates the wide dispersion of homicides throughout the City of Dallas, which is similar to the map included in the D Magazine stories on the same topic.  While the map provides a general illustration of the distribution of homicides, it lacks important information about the boundaries that define which city council districts are included in the South Dallas and non-South Dallas sectors.

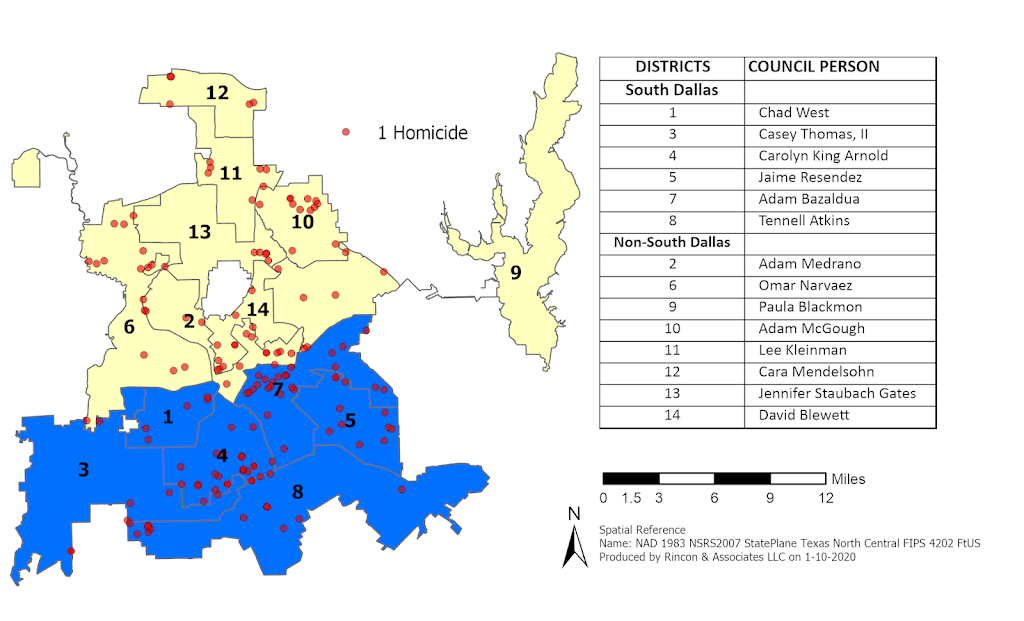
I produced the map below (Figure 1b) which presents the current city council district boundaries and council person names to better illustrate the geographic distribution of homicides, especially when drawing conclusions about the concentration of such crimes between South Dallas and non-South Dallas districts.

Figure 1b:  Distribution of Homicides by Dallas City Council Districts (N = 161)


Neither of these two maps, however, display all of the homicides for 2019 since complete information was available only for 164 cases in Figure 1a and 161 cases in Figure 1b when these maps were produced. These missing cases, of course, could change the overall pattern of homicides displayed by these two maps.
In addition to the lack of geographic precision in previous news reports, I decided to verify the 2016 crime rates in South Dallas reported in Urban Science by the two social scientists. My statistical analysis of 2016 violent and property crime rates using Dallas Police Department data revealed that the South Dallas crime rates reported in the Urban Science article were highly inflated and not supported by the sources that were cited in the published study. My analysis also confirmed that violent and property crimes were distributed throughout the City of Dallas and not overly concentrated in South Dallas.[xii]
Why the contradictory picture of homicides in South Dallas?  The contradictory picture of homicides may result from several factors. First, it is likely that the rush to report changes in homicide rates that reinforce pre-existing perceptions of crime in South Dallas may be one factor that precludes a more careful analysis of crime patterns. Secondly, South Dallas is composed of several council districts whose crime patterns can vary considerably.  Thirdly, Dallas County – whose population consists mainly of the City of Dallas — is among the top ten fastest growing counties in the U.S.[xiii], suggesting that an increase in the number of homicides could be a consequence of population growth as well.   

The consequences of inconsistent crime reporting are problematic for several reasons.  It is well known, for example, that the perception of high crime rates in urban communities has been a key factor in slowing their economic development.[xiv]  While some neighborhoods in urban communities may indeed show high crime rates, is it fair to stigmatize an entire community based on crime incidences in smaller neighborhoods?  Moreover, is it fair to stigmatize a community based on inaccurate or inflated crime rates?  Perhaps a closer look at crime patterns in the City of Dallas may help us to re-think what we currently know about crime rates in South Dallas.     
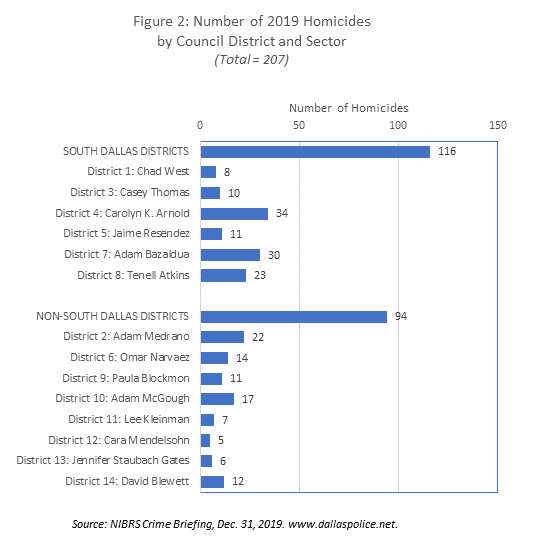
A closer look at the pattern of homicides in the City of Dallas challenges conventional thinking about crime. A more complete picture of 2019 homicides was obtained by accessing the Dallas Police Department’s NIBRS reports of crime activity dated as of 12-31-19.[xv]  Figure 2 below presents the distribution of the 207 homicides by council districts located in the South Dallas and non-South Dallas sectors of the city. From this chart, it is clear that a slight majority (56.0%) of the homicides occurred in the South Dallas districts, while less than half (44.0%) of the homicides occurred in the non-South Dallas districts.

Interestingly, the number of homicides varied greatly within the two sectors. For example, a higher number of homicides occurred in District 4 (n=34), District 7 (n=30), District 8 (n=23), District 2 (n-22), and District 10 (n=17).  In addition, several of the districts in the South Dallas sector revealed a relatively low number of homicides (District 1 (n=8), District 5 (n=11), and District 3 (n=10) when compared to some districts in the non-South Dallas sector.  Thus, individual districts in the non-South Dallas sector are also contributing to the overall number of 2019 homicides. However, what are the relative changes in the overall share of homicides since 2018 for the South Dallas and non-South Dallas sectors? This answer to this question is addressed by Figure 3 below. 

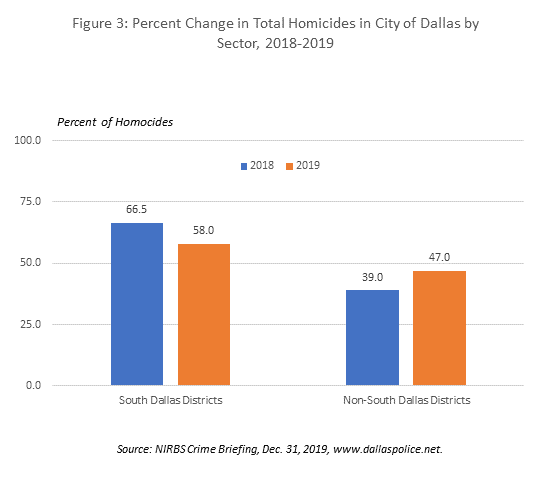
Figure 3 compared the change in the percent of total homicides between 2018 and 2019.  It is evident that the share of homicides in South Dallas districts declined from 66.5 percent in 2018 to 58.0 percent in 2019, while the share of homicides in non-South Dallas districts increased from 39.0 percent in 2018 to 47.0 percent in 2019. Thus, council districts in the South Dallas sector appear to be making progress in reducing their share of total homicides in 2019, while an increasing share of 2019 homicides has shifted to districts in the non-South Dallas sector – an important trend that should not be overlooked in future interventions by state and city leaders.
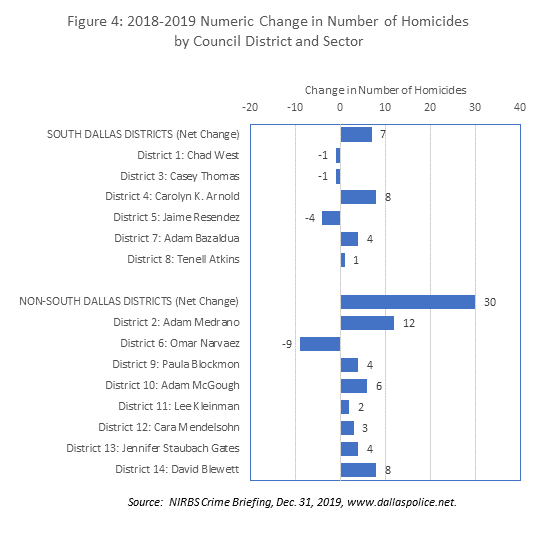
Figure 4 below examines changes in the number of homicides from 2018 to 2019 for each council district. First, the net change in homicides was considerably less (n=7) for the South Dallas districts when compared to the non-South Dallas districts (n=30).  It is particularly noteworthy that during this one-year period, three of the South Dallas districts showed decreases in the number of homicides, while most non-South Dallas districts showed increases in the number of homicides.    Indeed, only one non-South Dallas district (District 6) showed a decrease in the number of homicides.  Based on this analysis, it seems that the recent deployment of state troopers was misguided by the singular focus on the South Dallas community.
Lastly, I was curious about the geographic distribution of the 40 homicides that were previously reported for May of 2019 and used as justification by City leaders to invite DPS trooper support from Gov. Gregg Abbott.  In searching the same sources of police incidents used in this report, only 25 homicides were confirmed for May of 2019. Table 1 below summarizes the geographic distribution of these 25 homicides.
Table 1:  Distribution of Homicides for May 2019
District
No. Homicides
South Dallas
District 1
1
District 4
6
District 7
5
District 8
1
Subtotal
13
Non-South Dallas
District 6
3
District 9
3
District 10
1
District 11
2
District 12
2
District 14
1
Subtotal
12
 
As is readily apparent from Table 1, the number of homicides in the South Dallas and non-South Dallas sectors were nearly identical.  Consequently, one is left to wonder why the state troopers focused their intervention primarily on South Dallas.
Conclusion:  In summary, it seems that some improvement is needed in the manner that crime is analyzed as well as decisions that are based on these analyses.  In the case of social scientists, there is really no excuse for inflating crime statistics using unreliable sources.  Crime reports that lack geographic detail are likely to lead to misguided interventions, such as the state troopers that were sent to the South Dallas community that perhaps should have been directed to other non-South Dallas council districts that were experiencing relatively more increases in the number of homicides since 2018.
It might also be a good idea to recognize districts that show yearly progress in reducing the number of homicides or at least not showing any increases in the number of homicides.  Both journalists and social scientists need to exercise greater care in reporting crime trends in general, but particularly for communities like South Dallas whose quality of life has been negatively impacted by incomplete or inaccurate crime reports. Indeed, the sources of crime data used in this report are publicly available and not overly complex to analyze. 
The recent announcement by Chief Hall[xvi] about initiating a “predictive policing” plan offers some promise for reducing  crime by creating an intelligence-led policing unit that will “produce regular reports to forecast trends, identify patterns, and facilitate a more accurate picture of who is committing a crime and where….it will also generate a list of known offenders, active gang members, parolees, and sex offenders for each focus area.”  Some activists and community members, however, expressed skepticism and felt that the new plan will lead to racial profiling and more aggressive police tactics towards the victims of crime.
The predictive police plan, coupled with a more careful analysis of the geographic distribution of crime patterns, should help to direct interventions to the communities that show the greatest need – not just the usual suspects.
  
Reference Notes


[i]Garcia, N. (2019, Dec. 20). Dallas has 200 murders in 2019.  Here’s what that means. The Dallas Morning News.  Accessed at https://www.dallasnews.com/news/crime/2019/12/20/dallas-has-had-200-murders-in-2019-heres-what-that-means/
[ii] Jaramillo, C.  (2019, June 7).  Texas Gov. Gregg Abbott announces he’s sending state troopers to Dallas to tackle violent crime. Dallas Morning News. Accessed at https://www.dallasnews.com/news/2019/06/08/texas-gov-greg-abbott-announces-he-s-sending-state-troopers-to-dallas-to-help-tackle-violent-crime/
[iii]Byrne, E. (2019, June 7).  Gov. Gregg Abbott deploys DPS to combat Dallas violent crime spike. The Texas Tribune. Access at https://www.texastribune.org/2019/06/07/Texas-governor-Greg-Abbott-DPS-Dallas-crime/
[iv]Jaramillo, C.  (2019, June 7). Texas Gov. Gregg Abbott announces he’s sending state troopers to Dallas to help tackle violet crime. The Dallas Morning News, Accessed at https://www.dallasnews.com/news/2019/06/08/texas-gov-greg-abbott-announces-he-s-sending-state-troopers-to-dallas-to-help-tackle-violent-crime/
[v]Perez, G. (2019, August 5). Are state troopers in South Dallas doing more harm than good?  Texas Standard,  Accessed at https://www.texasstandard.org/stories/are-state-troopers-in-south-dallas-doing-more-harm-than-good/
[vi]Jaramilllo, C. (2020, January 3). South Dallas man slain by DPS troopers after traffic stop had 16 gunshot wounds, autopsy shows.  The Dallas Morning News.  Accessed at https://www.dallasnews.com/news/crime/2020/01/04/south-dallas-man-slain-by-dps-troopers-after-traffic-stop-had-16-gunshot-wounds-autopsy-shows/
[vii]Ibid, Garcia N. (2019).
[viii]Crowe, J., Lacy, C., and Columbus, Y. (2019).  Barriers to food security and community stress in an urban food desert. Urban Science. Accessed at  https://www.mdpi.com/2413-8851/2/2/46
[ix]Wise, K. (2019, December 13). Dallas homicides are pretty much everywhere. D Magazine.  Accessed at https://www.dmagazine.com/frontburner/2019/12/dallas-homicides-are-pretty-much-everywhere/
[x]Shinneman, S. (2019, December 18). Explore this updated map of Dallas’ 2019 homicides.  D Magazine, December.  Accessed at https://www.dmagazine.com/frontburner/2019/12/explore-this-updated-map-of-dallas-2019-homicides/
[xi]Kathoff, K. Dallas homicides happening all over the city.  NBC 5 Dallas-Ft. Worth.  Accessed at  https://www.nbcdfw.com/news/local/dallas-homicides-happening-all-over-the-city/2271971/
[xii] Rincon, E.T. and Tiwari, C. (2019).  Construction of a Demand Metric for Supermarket Site Selection: A Case Study of South Dallas. Presentation at Applied Geography Conference, Charlotte NC, October 24, 2019
[xiii]Census Bureau, New Census Bureau estimates show counties in South and West lead nation in population growth. Release No. CB 19-55, Table 3 Top 10 Counties in Percentage Growth: 2017-2018.  Accessed at https://www.census.gov/newsroom/press-releases/2019/estimates-county-metro.html
[xiv]Ibid, Rincon, E.T. and Tiwari, C. (2019). 
[xv]City Council Briefing, NIBRS Crime Briefing, Reported through Tuesday, December 31, 2019.  Accessed at http://www.dallaspolice.net/resources/CrimeReports/NIBRS%20Weekly%20Admin%20Council%20Report%20New.pdf
[xvi]Jaramillo, C. (2020, January 3).  ‘Predictive policing,’ part of Chief Hall’s crime plan, raises concerns.  The Dallas Morning News.  Accessed at https://www.dallasnews.com/news/crime/2020/01/04/predictive-policing-part-of-chief-halls-crime-plan-raises-concerns/

Ethnic Cleansing: Trump’s New Strategy


          If you were under the impression that ethnic cleansing takes place only in other countries with maniacal dictators, perhaps it is time to reflect on the recent behavior of President Trump in regards to recovery efforts in Puerto Rico following Hurricane Maria.  By some accounts, the disaster recovery in Puerto Rico was a clear example of the deliberate and prolonged neglect of a large segment of U.S. citizens.

An estimated 3,000 Puerto Rican residents died as a result of Hurricane Maria – not just from the immediate storm but also from the inadequate recovery efforts that allowed too many victims to suffer from the limited access to clean water, food, transportation and medical attention. The level of human misery in Puerto Rico, which continues to this day, was apparently of little consequence to President Trump who boasted that the recovery effort was one of the most successful in U.S. history.  Making matters worse, President Trump even now rejects the estimate of 3,000 deaths from Hurricane Maria, suggesting that the high death estimate was merely a political ploy by Democrats to “make me look bad.”   

Trump’s suggestion that the 3,000 deaths resulting from Hurricane Maria was a political ploy by Democrats is consistent with other conspiracy theories that point to his detachment from reality, including such things as:

·        Promotion of the birther theory regarding President Obama;
·       The claim that Muslims celebrated 9/11 on rooftops;
·        Suggesting that Ted Cruz’s father was involved in the JFK assassination; and
·        Claiming that 3 to 5 million illegal votes were cast in the 2016 election.

President Trump has made no secret of his disdain for Puerto Rico and its leadership, even delaying the waiver of the Jones Act to expedite the delivery of needed resources. Indeed, his disdain for other non-white and immigrant groups has been shown through statements and policies, including the separation of Latino children from their families;  legal action to end the DACA program;  travel restrictions based on religious beliefs;  and the consistent derogatory statements made in reference to Mexicans,  Haitians, black athletes, and war heroes like the late Senator McCain.  More recently, the Trump administration announced the transfer of $10 million from the FEMA budget to ICE  — an action that further underscores the priority placed on the removal of unwanted groups.  Perhaps it is time to ask: Is President Trump developing a program of ethnic cleansing? 

As defined by a United Nations Commission, ethnic cleansing is defined as follows:   
“….rendering an area ethnically homogeneous by using force or intimidation to remove persons of given groups from the area… a purposeful policy designed by one ethnic or religious group to remove by violent and terror-inspiring means the civilian population of another ethnic or religious group from certain geographic areas. “
Since he became president, Donald Trump has implemented a number of programs that could fall under this definition of ethnic cleansing,  including  arbitrary arrest and detention; confinement in ghetto areas (i.e., families in detention centers); forcible removal;  displacement and deportation (i.e., even asylum seekers);  deliberate attacks or threats of attacks on civilians (i.e., especially protestors at campaign rallies); and robbery of personal property (that is, seizure of personal property from forcibly removed persons). 

Although Trump has yet to implement some of the most coercive practices that have been utilized globally by current and past dictators, following is a listing of the various practices that have been used to achieve the objectives of ethnic cleansing:
  • Murder
  • Torture
  • Extrajudicial executions
  • Rape and sexual assaults
  • Severe physical injury to civilians
  • Use of civilians as human shields
  • Destruction of property
  • Attacks on hospitals, medical personnel and locations with the Red Cross/Red Crescent emblem, among others.

Without intervention by legal advocates and human rights organizations, one wonders how many of these most coercive practices President Trump would implement given the opportunity and growing support by his conservative base.  Yet, the withholding and delay of needed emergency assistance and the resulting 3,000 deaths of Puerto Rican citizens presents tangible evidence that President Trump has added a new dimension to the ethnic cleansing formula. 

Apparently, it is not enough to separate families, deport asylum seekers, place immigrant children in detention centers, and publicly disparage immigrants and non-whites – it now appears acceptable to simply delay or withhold emergency assistance in order to punish or remove unwanted segments of the U.S. population.  To say the least, this is a disturbing development and made equally frightening by the many “pro-life” Republicans who choose to remain silent on this issue.