Undermining the 2020 Census: Trump’s Toxic Brew of Crime, Hysteria and Immigrants

In a recent news story, The New York Times tells us that the Trump administration is sending elite tactical Border Patrol teams (BORTRAC) to sanctuary cities that “release dangerous criminal aliens to prey upon the public.” [i]  Sanctuary cities are targeted because local officials have refused to provide  support to ICE in enforcing immigration policies that are perceived as pushing undocumented people further into the shadows, making cities less safe as immigrant become less likely to report crimes or cooperate with investigations.
These BORTAC agents are accustomed to engaging in armed confrontations with drug-smuggling suspects using armored vehicles. They act as the SWAT team of the Border Patrol using such gear as stun grenades and enhanced Special Forces-type training. The officers usually target individuals who are known to be violent with extensive criminal records. Local officials have voiced concerns about the increased militarizing of their communities that could also have deadly consequences. The interventions also result in “collateral arrests” involving innocent family members.    
   
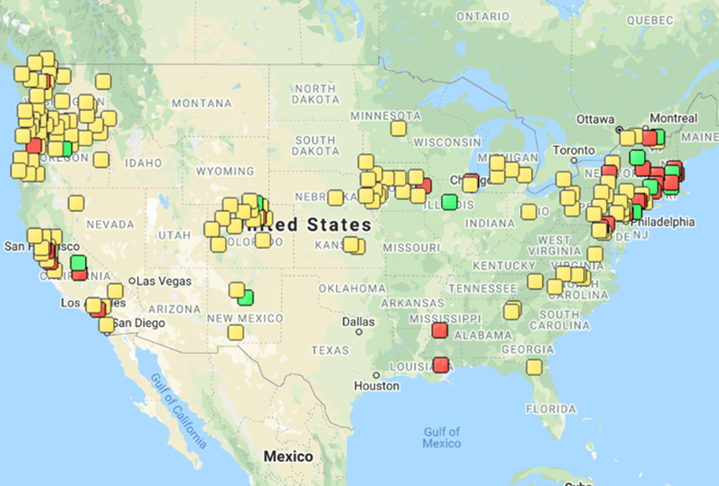
This terror campaign against sanctuary cities is broad in its scope and includes large cities like Chicago, New York, San Francisco, Los Angeles, Atlanta, Houston, Boston, New Orleans, Detroit and Newark, N.J. The map[ii]below, produced by The Center for Immigration Studies, shows the current distribution of sanctuary counties (yellow), cities (red) and states (green) throughout the U.S.  Importantly, there are many communities throughout the U.S. with substantial numbers of immigrants that are not sanctuaries and thus excluded from this map.
Figure 1: Distribution of Sanctuary Cities, Counties and States, 2020
Source:  Center for Immigration Studies, February 2020.

Interestingly, it is no coincidence that the BORTRAC agents are being deployed from February  through May of this year – the same period of time that the 2020 Census is being conducted.   Previously, the Trump administration also worked feverishly to include a citizenship question in the 2020 Census questionnaire which was rejected by the courts due to its potential to discourage response rates of the nation’s immigrant population. Similarly, the deployment of BORTRAC agents is designed to create fear and anxiety among immigrants in sanctuary cities that is likely to discourage participation in the 2020 Census. 
Why does this matter?  Because access to millions of federal dollars by cities throughout the nation are jeopardized by a Census under-count – funds that are used to support schools, hospitals, roads and highways, and other infrastructure needs. The irony is that a Census under-count will impact not just sanctuary cities, but many communities with substantial immigrant populations that are not sanctuaries.  For example, Dallas County is not included in the list of sanctuary counties, but it is estimated that $40 million in federal funds will be lost for every 1 percent drop in the Census response rate. [i]

To justify this reign of terror, the Trump administration explains that the elite agents will assist the targeted communities in handling “dangerous criminal illegal aliens” that are being protected by sanctuary cities. The facts about immigrant crime, however, have established over numerous studies that immigrants do not increase local crime rates, are less likely to cause crime and less likely to be incarcerated than their native-born peers – important facts that were included in a recent review by The Cato Institute regarding immigrant crime rates in the U.S. and the State of Texas. [ii]  In their in-depth analysis of data from the Texas Department of Public Safety, Institute investigators analyzed the arrests and convictions for the year 2015 to determine the extent to which different crimes were conducted by illegal immigrants, legal immigrants and the native born.  The conclusion from their analysis, quoted below, provides concrete evidence that the Trump narrative about “dangerous criminal aliens” is false and misguided:
“The homicide conviction rate for illegal immigrants was 16 percent below that of native-born Americans in Texas in 2015. The conviction rates for illegal immigrants were 7.9 percent and 77 percent below that for native-born Americans for sex crimes and larceny, respectively.  For all criminal convictions in Texas in 2015, illegal immigrants had a criminal conviction rate 50 percent below that of native-born Americans.  Legal immigrants had a criminal conviction rate 66 percent below that of native-born Americans.”  (p.5)
Crime, therefore, is merely a pretext for justifying the deployment of BORTRAC agents in sanctuary communities – a pretentious show of force whose only purpose is to discourage participation of immigrants in the 2020 Census and enhance the political positioning of the Republican party.
Also lost in the campaign to target sanctuary cities are the substantial contributions made by immigrants,  both legal and undocumented, to the U.S. economy, the defense of our nation in times of war, the many patents for inventions at U.S. academic institutions, keeping the Social Security system solvent, and the numerous jobs created by entrepreneurs. [iii]
The Trump administration and the GOP have demonstrated an uncanny ability of fortifying their political power by implementing draconian policies that punish immigrant families and the public entities that value and support immigrants. I am hopeful, nonetheless, that the supportive network of sanctuary cities, counties and states will remain steadfast in their support and maintain careful vigilance over the newly deployed tactical agents to discourage the use of aggressive or violent behavior towards immigrant residents. Non-sanctuary cities should be equally concerned about the potential loss of federal dollars in their communities as well since the deployment of BORTRAC agents will be communicated by news media throughout the nation.
In the meantime, the Census Bureau will be doubly challenged to ensure an accurate count in the 2020 Census as Trump’s elite forces are deployed in the sanctuary cities. To minimize potential confrontations with ICE and Trump’s elite forces, perhaps immigrants should be strongly encouraged to complete the online version of the Census questionnaire on their smart phones, home computers or other devices. Trump should not be handed a victory by allowing his elite forces to suppress Census participation, depriving communities of important federal funds, and shaping the balance of political representation.
U.S. residents should realize that when immigrants lose, we all lose.       

Reference Notes

[i] Dallas County, Texas (2018). Request for Proposal for 2020 Census Participation Initiative for Dallas County, Page 21.
[ii] Nowrasteh, A. (2018).  Criminal immigrants in Texas:  Illegal immigrant conviction and arrest rates for homicide, sex crimes, larceny, and other crimes. Immigration Research and Policy Brief No. 4, The Cato Institute. Accessed at https://www.cato.org/publications/immigration-research-policy-brief/criminal-immigrants-texas-illegal-immigrant
[iii] Rincón, E. T. (2017). Sanctuary city politics:  Wolves in sheep’s clothing.  TribTalk – Perspectives on Texas. A Publication of the Texas Tribune.  Accessed at https://www.tribtalk.org/2017/02/13/sanctuary-city-politics-wolves-in-sheeps-clothing/


[i]Dickerson, C. and Kanno-Youngs, Z. (2020).  Border Patrol will deploy elite tactical agents to sanctuary cities. The New York Times, accessed at https://www.nytimes.com/2020/02/14/us/Border-Patrol-ICE-Sanctuary-Cities.html
[ii]Griffin, B. and Vaughan, J.S. (2020). Center for Immigration Studies, accessed at https://cis.org/Map-Sanctuary-Cities-Counties-and-States

What hurts South Dallas more – crime or the hasty reporting of crime?

A recent headline in The Dallas Morning News sent its readers a chilling message: “Dallas has had 200 murders in 2019. Here’s what that means.” [i] It reminded everyone of the unfortunate consequences of urban growth and the absence of sensible gun control. With 40 homicides recorded for the month of May according to news reports,[ii] Chief of Police Hall requested that Gov. Gregg Abbott send state troopers to assist the under-staffed Dallas Police Department to help control the alarming rise in homicides.[iii] 

Although few specifics were provided on the type of support that the state troopers provided,[iv] news reports indicated that it was focused on the South Dallas community, that community residents felt that the troopers presence did more harm than good and created a sense of distrust.[v] This sense of distrust of DPS troopers was underscored by the slaying of a black resident in South Dallas who was stopped for failing to signal a turn.[vi] Although conflicting reports emerged about whether the victim had drawn a gun or not, the Texas Department of Public Safety declined to release video footage of the incident, and the two state troopers were not indicted for the incident.  The victim had been shot 16 times by the state troopers – five times in the front and four times in the back of his torso according to the autopsy report.

This is not the first time that South Dallas has been singled out in reports related to increased crime.  Interestingly, the Dallas Morning News story further explained that the “majority of homicides occurred in South Dallas zip codes” but did not provide its readers any detailed crime statistics to support this conclusion.[vii]
Adding fuel to the fire was a recent study of South Dallas published in Urban Science [viii]by two social scientists who concluded that “South Dallas is safer than only 13% of the cities in Texas and there is a 1 in 17 chance of becoming a victim of any crime.”
In providing such a disparaging picture of South Dallas, one would hope that journalists and social scientists are doing their due diligence in analyzing crime data.  Unfortunately, that is not always the case.  
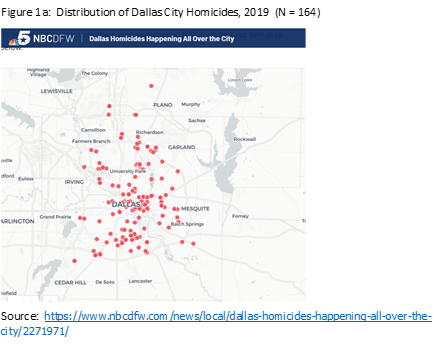
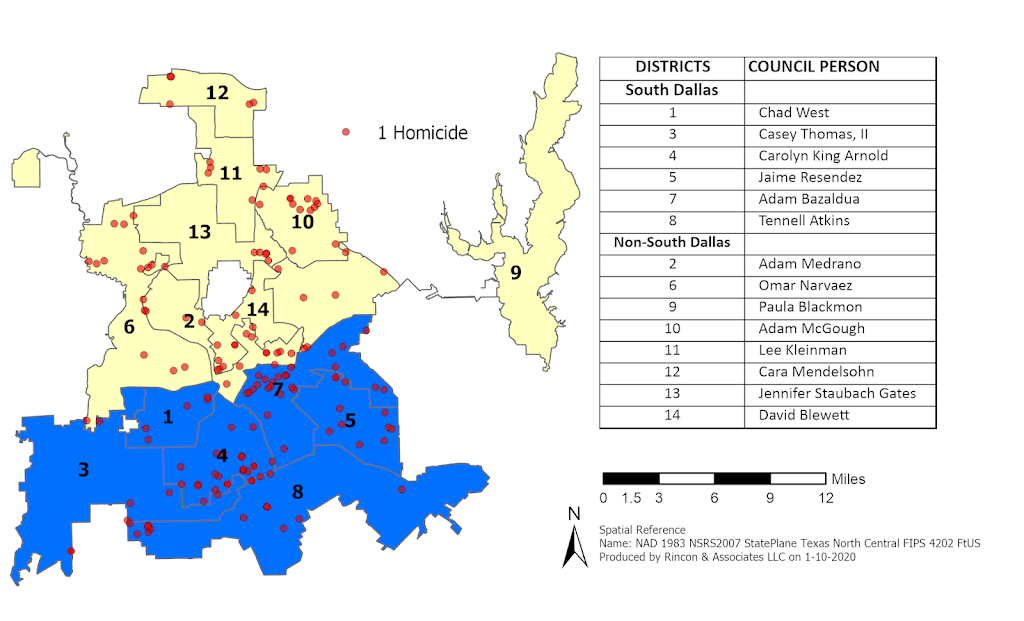
Indeed, other independent analyses provide a different picture of crime in South Dallas. For example, D Magazine[ix][x] and NBC 5[xi] recently released news stories that addressed the pattern of homicides by including a map of City of Dallas 2019 homicides produced by Robert Mundinger (www.themap.net). According to these stories, homicides were “pretty much everywhere.” Figure 1a below displays the map of homicides included in the NBC 5 story which illustrates the wide dispersion of homicides throughout the City of Dallas, which is similar to the map included in the D Magazine stories on the same topic.  While the map provides a general illustration of the distribution of homicides, it lacks important information about the boundaries that define which city council districts are included in the South Dallas and non-South Dallas sectors.

I produced the map below (Figure 1b) which presents the current city council district boundaries and council person names to better illustrate the geographic distribution of homicides, especially when drawing conclusions about the concentration of such crimes between South Dallas and non-South Dallas districts.

Figure 1b:  Distribution of Homicides by Dallas City Council Districts (N = 161)


Neither of these two maps, however, display all of the homicides for 2019 since complete information was available only for 164 cases in Figure 1a and 161 cases in Figure 1b when these maps were produced. These missing cases, of course, could change the overall pattern of homicides displayed by these two maps.
In addition to the lack of geographic precision in previous news reports, I decided to verify the 2016 crime rates in South Dallas reported in Urban Science by the two social scientists. My statistical analysis of 2016 violent and property crime rates using Dallas Police Department data revealed that the South Dallas crime rates reported in the Urban Science article were highly inflated and not supported by the sources that were cited in the published study. My analysis also confirmed that violent and property crimes were distributed throughout the City of Dallas and not overly concentrated in South Dallas.[xii]
Why the contradictory picture of homicides in South Dallas?  The contradictory picture of homicides may result from several factors. First, it is likely that the rush to report changes in homicide rates that reinforce pre-existing perceptions of crime in South Dallas may be one factor that precludes a more careful analysis of crime patterns. Secondly, South Dallas is composed of several council districts whose crime patterns can vary considerably.  Thirdly, Dallas County – whose population consists mainly of the City of Dallas — is among the top ten fastest growing counties in the U.S.[xiii], suggesting that an increase in the number of homicides could be a consequence of population growth as well.   

The consequences of inconsistent crime reporting are problematic for several reasons.  It is well known, for example, that the perception of high crime rates in urban communities has been a key factor in slowing their economic development.[xiv]  While some neighborhoods in urban communities may indeed show high crime rates, is it fair to stigmatize an entire community based on crime incidences in smaller neighborhoods?  Moreover, is it fair to stigmatize a community based on inaccurate or inflated crime rates?  Perhaps a closer look at crime patterns in the City of Dallas may help us to re-think what we currently know about crime rates in South Dallas.     
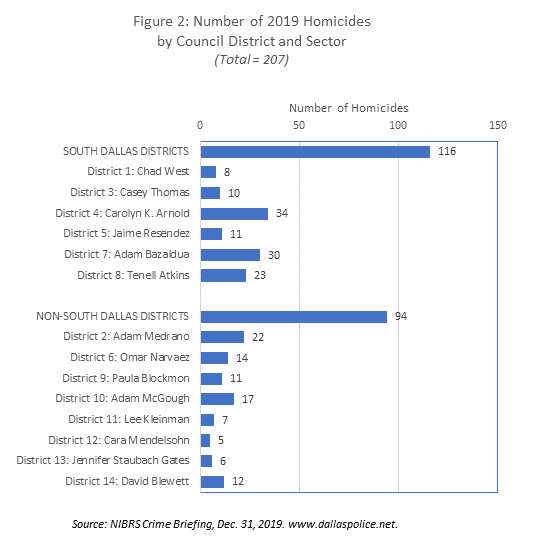
A closer look at the pattern of homicides in the City of Dallas challenges conventional thinking about crime. A more complete picture of 2019 homicides was obtained by accessing the Dallas Police Department’s NIBRS reports of crime activity dated as of 12-31-19.[xv]  Figure 2 below presents the distribution of the 207 homicides by council districts located in the South Dallas and non-South Dallas sectors of the city. From this chart, it is clear that a slight majority (56.0%) of the homicides occurred in the South Dallas districts, while less than half (44.0%) of the homicides occurred in the non-South Dallas districts.

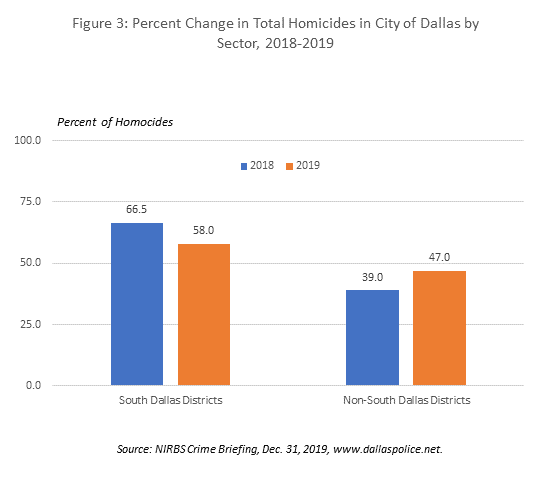
Interestingly, the number of homicides varied greatly within the two sectors. For example, a higher number of homicides occurred in District 4 (n=34), District 7 (n=30), District 8 (n=23), District 2 (n-22), and District 10 (n=17).  In addition, several of the districts in the South Dallas sector revealed a relatively low number of homicides (District 1 (n=8), District 5 (n=11), and District 3 (n=10) when compared to some districts in the non-South Dallas sector.  Thus, individual districts in the non-South Dallas sector are also contributing to the overall number of 2019 homicides. However, what are the relative changes in the overall share of homicides since 2018 for the South Dallas and non-South Dallas sectors? This answer to this question is addressed by Figure 3 below. 

Figure 3 compared the change in the percent of total homicides between 2018 and 2019.  It is evident that the share of homicides in South Dallas districts declined from 66.5 percent in 2018 to 58.0 percent in 2019, while the share of homicides in non-South Dallas districts increased from 39.0 percent in 2018 to 47.0 percent in 2019. Thus, council districts in the South Dallas sector appear to be making progress in reducing their share of total homicides in 2019, while an increasing share of 2019 homicides has shifted to districts in the non-South Dallas sector – an important trend that should not be overlooked in future interventions by state and city leaders.
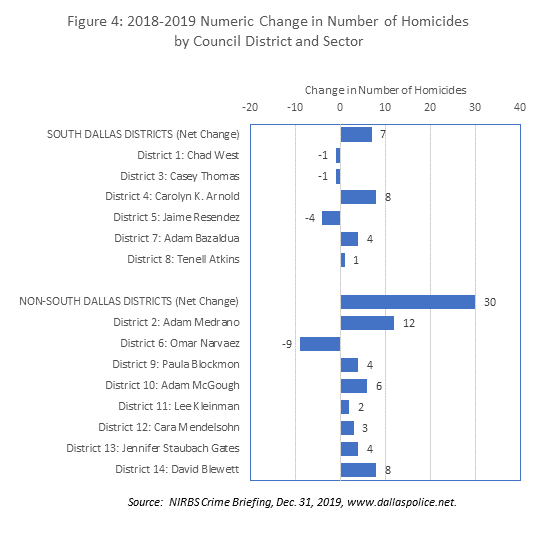
Figure 4 below examines changes in the number of homicides from 2018 to 2019 for each council district. First, the net change in homicides was considerably less (n=7) for the South Dallas districts when compared to the non-South Dallas districts (n=30).  It is particularly noteworthy that during this one-year period, three of the South Dallas districts showed decreases in the number of homicides, while most non-South Dallas districts showed increases in the number of homicides.    Indeed, only one non-South Dallas district (District 6) showed a decrease in the number of homicides.  Based on this analysis, it seems that the recent deployment of state troopers was misguided by the singular focus on the South Dallas community.
Lastly, I was curious about the geographic distribution of the 40 homicides that were previously reported for May of 2019 and used as justification by City leaders to invite DPS trooper support from Gov. Gregg Abbott.  In searching the same sources of police incidents used in this report, only 25 homicides were confirmed for May of 2019. Table 1 below summarizes the geographic distribution of these 25 homicides.
Table 1:  Distribution of Homicides for May 2019
District
No. Homicides
South Dallas
District 1
1
District 4
6
District 7
5
District 8
1
Subtotal
13
Non-South Dallas
District 6
3
District 9
3
District 10
1
District 11
2
District 12
2
District 14
1
Subtotal
12
 
As is readily apparent from Table 1, the number of homicides in the South Dallas and non-South Dallas sectors were nearly identical.  Consequently, one is left to wonder why the state troopers focused their intervention primarily on South Dallas.
Conclusion:  In summary, it seems that some improvement is needed in the manner that crime is analyzed as well as decisions that are based on these analyses.  In the case of social scientists, there is really no excuse for inflating crime statistics using unreliable sources.  Crime reports that lack geographic detail are likely to lead to misguided interventions, such as the state troopers that were sent to the South Dallas community that perhaps should have been directed to other non-South Dallas council districts that were experiencing relatively more increases in the number of homicides since 2018.
It might also be a good idea to recognize districts that show yearly progress in reducing the number of homicides or at least not showing any increases in the number of homicides.  Both journalists and social scientists need to exercise greater care in reporting crime trends in general, but particularly for communities like South Dallas whose quality of life has been negatively impacted by incomplete or inaccurate crime reports. Indeed, the sources of crime data used in this report are publicly available and not overly complex to analyze. 
The recent announcement by Chief Hall[xvi] about initiating a “predictive policing” plan offers some promise for reducing  crime by creating an intelligence-led policing unit that will “produce regular reports to forecast trends, identify patterns, and facilitate a more accurate picture of who is committing a crime and where….it will also generate a list of known offenders, active gang members, parolees, and sex offenders for each focus area.”  Some activists and community members, however, expressed skepticism and felt that the new plan will lead to racial profiling and more aggressive police tactics towards the victims of crime.
The predictive police plan, coupled with a more careful analysis of the geographic distribution of crime patterns, should help to direct interventions to the communities that show the greatest need – not just the usual suspects.
  
Reference Notes


[i]Garcia, N. (2019, Dec. 20). Dallas has 200 murders in 2019.  Here’s what that means. The Dallas Morning News.  Accessed at https://www.dallasnews.com/news/crime/2019/12/20/dallas-has-had-200-murders-in-2019-heres-what-that-means/
[ii] Jaramillo, C.  (2019, June 7).  Texas Gov. Gregg Abbott announces he’s sending state troopers to Dallas to tackle violent crime. Dallas Morning News. Accessed at https://www.dallasnews.com/news/2019/06/08/texas-gov-greg-abbott-announces-he-s-sending-state-troopers-to-dallas-to-help-tackle-violent-crime/
[iii]Byrne, E. (2019, June 7).  Gov. Gregg Abbott deploys DPS to combat Dallas violent crime spike. The Texas Tribune. Access at https://www.texastribune.org/2019/06/07/Texas-governor-Greg-Abbott-DPS-Dallas-crime/
[iv]Jaramillo, C.  (2019, June 7). Texas Gov. Gregg Abbott announces he’s sending state troopers to Dallas to help tackle violet crime. The Dallas Morning News, Accessed at https://www.dallasnews.com/news/2019/06/08/texas-gov-greg-abbott-announces-he-s-sending-state-troopers-to-dallas-to-help-tackle-violent-crime/
[v]Perez, G. (2019, August 5). Are state troopers in South Dallas doing more harm than good?  Texas Standard,  Accessed at https://www.texasstandard.org/stories/are-state-troopers-in-south-dallas-doing-more-harm-than-good/
[vi]Jaramilllo, C. (2020, January 3). South Dallas man slain by DPS troopers after traffic stop had 16 gunshot wounds, autopsy shows.  The Dallas Morning News.  Accessed at https://www.dallasnews.com/news/crime/2020/01/04/south-dallas-man-slain-by-dps-troopers-after-traffic-stop-had-16-gunshot-wounds-autopsy-shows/
[vii]Ibid, Garcia N. (2019).
[viii]Crowe, J., Lacy, C., and Columbus, Y. (2019).  Barriers to food security and community stress in an urban food desert. Urban Science. Accessed at  https://www.mdpi.com/2413-8851/2/2/46
[ix]Wise, K. (2019, December 13). Dallas homicides are pretty much everywhere. D Magazine.  Accessed at https://www.dmagazine.com/frontburner/2019/12/dallas-homicides-are-pretty-much-everywhere/
[x]Shinneman, S. (2019, December 18). Explore this updated map of Dallas’ 2019 homicides.  D Magazine, December.  Accessed at https://www.dmagazine.com/frontburner/2019/12/explore-this-updated-map-of-dallas-2019-homicides/
[xi]Kathoff, K. Dallas homicides happening all over the city.  NBC 5 Dallas-Ft. Worth.  Accessed at  https://www.nbcdfw.com/news/local/dallas-homicides-happening-all-over-the-city/2271971/
[xii] Rincon, E.T. and Tiwari, C. (2019).  Construction of a Demand Metric for Supermarket Site Selection: A Case Study of South Dallas. Presentation at Applied Geography Conference, Charlotte NC, October 24, 2019
[xiii]Census Bureau, New Census Bureau estimates show counties in South and West lead nation in population growth. Release No. CB 19-55, Table 3 Top 10 Counties in Percentage Growth: 2017-2018.  Accessed at https://www.census.gov/newsroom/press-releases/2019/estimates-county-metro.html
[xiv]Ibid, Rincon, E.T. and Tiwari, C. (2019). 
[xv]City Council Briefing, NIBRS Crime Briefing, Reported through Tuesday, December 31, 2019.  Accessed at http://www.dallaspolice.net/resources/CrimeReports/NIBRS%20Weekly%20Admin%20Council%20Report%20New.pdf
[xvi]Jaramillo, C. (2020, January 3).  ‘Predictive policing,’ part of Chief Hall’s crime plan, raises concerns.  The Dallas Morning News.  Accessed at https://www.dallasnews.com/news/crime/2020/01/04/predictive-policing-part-of-chief-halls-crime-plan-raises-concerns/

Ethnic Cleansing: Trump’s New Strategy


          If you were under the impression that ethnic cleansing takes place only in other countries with maniacal dictators, perhaps it is time to reflect on the recent behavior of President Trump in regards to recovery efforts in Puerto Rico following Hurricane Maria.  By some accounts, the disaster recovery in Puerto Rico was a clear example of the deliberate and prolonged neglect of a large segment of U.S. citizens.

An estimated 3,000 Puerto Rican residents died as a result of Hurricane Maria – not just from the immediate storm but also from the inadequate recovery efforts that allowed too many victims to suffer from the limited access to clean water, food, transportation and medical attention. The level of human misery in Puerto Rico, which continues to this day, was apparently of little consequence to President Trump who boasted that the recovery effort was one of the most successful in U.S. history.  Making matters worse, President Trump even now rejects the estimate of 3,000 deaths from Hurricane Maria, suggesting that the high death estimate was merely a political ploy by Democrats to “make me look bad.”   

Trump’s suggestion that the 3,000 deaths resulting from Hurricane Maria was a political ploy by Democrats is consistent with other conspiracy theories that point to his detachment from reality, including such things as:

·        Promotion of the birther theory regarding President Obama;
·       The claim that Muslims celebrated 9/11 on rooftops;
·        Suggesting that Ted Cruz’s father was involved in the JFK assassination; and
·        Claiming that 3 to 5 million illegal votes were cast in the 2016 election.

President Trump has made no secret of his disdain for Puerto Rico and its leadership, even delaying the waiver of the Jones Act to expedite the delivery of needed resources. Indeed, his disdain for other non-white and immigrant groups has been shown through statements and policies, including the separation of Latino children from their families;  legal action to end the DACA program;  travel restrictions based on religious beliefs;  and the consistent derogatory statements made in reference to Mexicans,  Haitians, black athletes, and war heroes like the late Senator McCain.  More recently, the Trump administration announced the transfer of $10 million from the FEMA budget to ICE  — an action that further underscores the priority placed on the removal of unwanted groups.  Perhaps it is time to ask: Is President Trump developing a program of ethnic cleansing? 

As defined by a United Nations Commission, ethnic cleansing is defined as follows:   
“….rendering an area ethnically homogeneous by using force or intimidation to remove persons of given groups from the area… a purposeful policy designed by one ethnic or religious group to remove by violent and terror-inspiring means the civilian population of another ethnic or religious group from certain geographic areas. “
Since he became president, Donald Trump has implemented a number of programs that could fall under this definition of ethnic cleansing,  including  arbitrary arrest and detention; confinement in ghetto areas (i.e., families in detention centers); forcible removal;  displacement and deportation (i.e., even asylum seekers);  deliberate attacks or threats of attacks on civilians (i.e., especially protestors at campaign rallies); and robbery of personal property (that is, seizure of personal property from forcibly removed persons). 

Although Trump has yet to implement some of the most coercive practices that have been utilized globally by current and past dictators, following is a listing of the various practices that have been used to achieve the objectives of ethnic cleansing:
  • Murder
  • Torture
  • Extrajudicial executions
  • Rape and sexual assaults
  • Severe physical injury to civilians
  • Use of civilians as human shields
  • Destruction of property
  • Attacks on hospitals, medical personnel and locations with the Red Cross/Red Crescent emblem, among others.

Without intervention by legal advocates and human rights organizations, one wonders how many of these most coercive practices President Trump would implement given the opportunity and growing support by his conservative base.  Yet, the withholding and delay of needed emergency assistance and the resulting 3,000 deaths of Puerto Rican citizens presents tangible evidence that President Trump has added a new dimension to the ethnic cleansing formula. 

Apparently, it is not enough to separate families, deport asylum seekers, place immigrant children in detention centers, and publicly disparage immigrants and non-whites – it now appears acceptable to simply delay or withhold emergency assistance in order to punish or remove unwanted segments of the U.S. population.  To say the least, this is a disturbing development and made equally frightening by the many “pro-life” Republicans who choose to remain silent on this issue.

Takata Recall Campaign: Consumer Safety Threatened by Corporate Greed and Government Missteps

If you are one of the unfortunate owners of a vehicle that has been recalled due to a defective Takata airbag, I feel your pain. Driving a vehicle with an airbag that could explode on impact and kill or injure you or your passengers is unnerving to say the least.  But being forced to drive it without access to a replacement vehicle from the auto dealer where it was purchased clearly puts the nail in the coffin.

The U.S. community is no stranger to product recalls, especially those that pose an immediate danger to public health.  Indeed, we are accustomed to seeing contaminated food products removed from store shelves, factories closed when listeria has contaminated our food supply, persons isolated when they have been diagnosed with a deadly virus like Ebola, and emergency teams deployed to communities impacted by natural disasters.   Responses to such events have one thing in common:  they never rely on just one method of communicating with the public about these dangers, and often include a mix of broadcast media, social media, public bulletins, city-wide sirens, community churches, and other approaches.  Our traditional response has been effective in quickly isolating the danger to the public, thereby saving lives and reducing injuries.

For some curious reason, however, relatively little alarm and urgent action has been associated with the deaths and injuries that have resulted from the recognized failure of Takata airbags – 11 deaths and 180 injuries – a problem that was first reported by Honda about 8 years ago. [1]   Unlike other national public hazards, millions of vehicle drivers are being forced to operate their vehicles with these defective airbags and endangering their lives and family members. Why?  Presumably because there is a shortage of replacement parts. But there is more to this story than just a shortage of parts.

Especially troubling is the anemic airbag completion rate that automakers are showing in response to the national Takata recall campaign. According to a recent National Highway Traffic Administration (NHTSA) press release (12-9-16). [2]   46 million Takata airbags in 29 million U.S. vehicles have been recalled, but only 12.5 million of these airbags, or 27 percent, have been repaired. The ability of Takata to meet the 2019 completion deadline set by NHTSA looks really dim since an additional 64 to 69 million more inflators in 42 million U.S. vehicles are expected to be recalled over the next three years. Scott Upham, CEO of Valient Research, tracks airbag sales and recently stated in an interview that Takata is under tremendous financial strain from the recalls and likely to file bankruptcy unless help is provided by the Japanese government or automakers. [3]

The responsiveness of automakers to the national Takata recall has varied significantly and partially explains why the NTHSA declared recently that automakers were not doing enough to speed up the process. The following table displays the airbag repair completion rates by make of the vehicle as presented in the NHTSA web site.

Takata Airbag Completion Rates by Make of Vehicle, 2016

Make
Total Airbags Repaired
Completion Rate
Honda
8,289,301
50.31
FCA – Chrysler
1,469,233
33.77
Daimler Trucks North America
778
29.91
Toyota
1,478,852
29.52
Nissan
294,752
21.98
Ford
369,457
21.29
Subaru
185,470
19.60
Mitsubishi
19,719
17.30
Ferrari
441
15.58
BMW
246,301
13.23
Mazda
1,192,556
10.64
Daimler Vans USA LLC
1,822
2.33
Mercedes Benz
3,434
0.48
General Motors
671
0.22
 Source: www.nhtsa.gov

NHTSA cautions that these airbag completion rates do not represent the real-time status of recall performance since there are inherent delays in the repair status and the time that the repair is reported to NHTSA. Also, the agency explains that it is difficult to compare completion rates because “some recalls include vehicles that have been under recall for many years, whereas others reflect recalls that have only just started or have only started in a discreet geographic area due to parts restrictions.”  Nonetheless, it is safe to assume that these completion rates are a snapshot of the current challenge facing each automaker.  Honda, for example, had the largest number of recalled airbags but has managed to complete repairs for 50.3 percent of these airbags.  By contrast, automakers with large numbers of defective airbags had completion rates that were considerably lower:  Chrysler (34%), Toyota (30%), and Mazda (11%).  Most of the automakers had completion rates under 30 percent. Regardless of whether these completion rates were influenced by the lack of replacement parts from Takata or not, it is discomforting to hear from NHTSA that automakers may not be making their best efforts to reduce the number of potential deaths and injuries resulting from the defective Takata airbags. [4]

What explains the anemic recall completion rate to a public hazard that has already resulted in 11 deaths and 180 injuries?  In my view, shred responsibility falls on the shoulders of four key participants of the recall campaign:  NHTSA, the automotive industry, the vehicle owners, and Takata.
The NHTSA:  NHTSA has struggled to engage automakers and vehicle owners through its various directives and policy initiatives.  The agency’s standard news coverage about the Takata recall simply “urges” vehicle drivers to check their vehicle identification number on www.safecare.gov and to contact automotive dealers to replace the defective airbags. NHTSA has ordered 19 automakers to recall nearly 42 million cars, making it the largest recall in U.S. automotive history.[5]  The agency required automakers to send two notices to vehicle owners, mostly by mail,[6]   which is not likely to reach about 20 percent of consumers who move on a monthly basis and may not provide a forwarding address. The dismal airbag repair completion rates prompted NHTSA to voice its concern to automakers that they were not doing enough to contact vehicle owners, and “encouraged” them to try other tactics like mass advertising or social media – which are not legally required. [7]   NTHSA’s directives to the automotive industry were hampered by two other realities:  (a) it cannot legally force automakers and dealers to provide rental cars to customers who sometimes have to wait years for a replacement airbag, and (b) auto dealers selling used cars were not legally required to disclose to customers if a defective Takata airbag was present in the vehicle.[8] Curiously, it was not until June 1, 2016 that NHTSA issued a federal directive that required rental car agencies to fix any and all open safety defects before renting out vehicles to customers.[9]   More recently, the NHTSA ordered automakers to submit a “recall engagement plan” within 90 days to substantially improve their outreach to vehicle owners.  NHTSA has also initiated bus tours in high-priority states to improve awareness of the recall campaign among vehicle owners.[10]

Clearly, NHTSA is probably doing the best that it can within its legal constraints to expedite the Takata recall process, but the agency desperately needs more legislative support to force the automotive industry and vehicle drivers to comply with the recall objectives.  To date, NHTSA has received relatively little support from lawmakers to accelerate compliance with the Takata recall campaign. Senator Bill Nelson, a Florida Democrat whose state has experienced several of the deaths and injuries resulting from the failed Takata inflators, shared his frustration with the slow pace of the recalls:

“The top priority must be doing whatever is necessary to get these potentially deadly airbags out of people’s cars as quickly as possible.  If we wait another three or four years for these to get replaced, more people are likely to die.”  [11]

Lastly, NHTSA’s method for establishing priority vehicles for airbag repair is limited in two important ways.  Focusing repairs on vehicles located in hot and high humidity areas, for example, overlooks the many vehicles that will occasionally travel from less warm or low humid areas to hotter or more humid places like Texas.  Secondly, focusing attention on older vehicles makes sense, but what plans are in place to communicate with the many vehicle owners who are more likely to buy used or older vehicles – such as the lower income, the elderly, immigrants, or other vulnerable groups?

The Automotive Industry:  With the possible exception of Honda, some automakers have allowed corporate greed to shape their response to the millions of potential Takata recall victims who were, ironically, responsible for their success.   In some respects, this comes as no surprise since automakers have not always shown good faith towards its customers and have required federal intervention to protect consumers from deaths and injuries.  Four key examples come to mind:

  • Toyota:  As recently as 2014, Toyota was fined $1.2 billion by the U.S. Attorney General for their behavior in hiding safety defects from the public, calling it “shameful” and a “blatant disregard” for the law. A $1.2 billion criminal penalty, the largest for a car manufacturer in the U.S., was imposed by the Attorney General.[12]
  • Volkswagen: Volkswagen recently reached settlements emerging out of lawsuits from car owners and the U.S. Department of Justice after the Environmental Protection Agency said Volkswagen had fitted many of its cars with software to fool emissions tests.   One $1 billion settlement will give at least some owners of the remaining 80,000 diesel vehicles caught in the company’s emissions cheating scandal the option of a buyback and provide all of them with compensation on top of any repurchase or repairs.  The settlement with U.S. regulators and attorneys for owners of the 3-liter diesel cars will include a choice of a buyback for 20,000 vehicles. The company has reached a separate $1.2 billion deal with its U.S. dealers and is still facing potentially billions more in fines and penalties and possible criminal charges.[13] 
  • General Motors:  GM has paid roughly $2 billion in criminal and civil penalties and settlements stemming from a faulty ignition switch linked to 124 deaths and 275 injuries. The switch can slip out of place, causing engines to stall and cutting power to the brake, steering and air bag systems. The defect prompted the recall of 2.6 million vehicles in 2014. The company had previously acknowledged that some of its employees knew about the switch defect for years before a recall was initiated.[14] 
  • CarMax: CarMax Inc. and two other major used auto retailers have agreed to settle Federal Trade Commission charges that they touted how rigorously they inspect their used cars, yet failed to adequately disclose that some of the cars were subject to unrepaired safety recalls. The proposed consent orders will prohibit them from making unqualified inspection or safety-related claims about their used vehicles if any are subject to open, or unrepaired, safety recalls.[15] 
  • Rental Car Companies: Starting June 1, 2016, rental car agencies must fix any and all open safety defects before renting out vehicles to customers, giving the safety agency power to investigate and punish violators for the first time. It seems incredible that rental car companies had no second thoughts about placing their customers in danger until they were forced to comply by a government order.[16]  

Without aggressive government intervention, one can only imagine how many deaths and injuries could have resulted from the uncontrolled agreed of selected members of the automotive industry. This corporate greed and rather callous indifference to consumer safety has apparently re-surfaced in the Takata recall campaign as automakers appear content with doing the minimum required by NHTSA to communicate and support their customers during this crisis. For example, in recent interviews (4-15-16) with representatives of different automakers, a news reporter with the San Francisco Chronicle discovered the following car rental or loaner practices: [17]
  • Most automakers do not offer a loaner vehicle or free rental car to vehicle owners who are required to wait for a replacement airbag – which could take several years.
  • Honda has the most generous car rental policy that it communicates to customers via its web site. Since 2014, Honda has provided 232,000 loaner and rental cars to its customers – no doubt a key factor that has helped Honda achieve an airbag repair completion rate of 50 percent.
  • Mazda also communicates via its web site that customers can request a loader if they have received a recall notice, a program that has resulted in 1,234 free car rentals.
  • By contrast, Toyota, Nissan and BMW do not post information about car rentals on their web sites, but assume a more passive approach by providing a loaner car only if asked by the vehicle owner.
  • Ford and Volkswagen do not offer vehicle owners any alternative transportation.
The extent of this corporate greed is further illustrated in a recent Senate report released in June 2016 by Sen. Mark Nelson (D-Fla.) that tells us even more shocking news:  new cars are still being built with flawed Takata airbags, which will continue until 2018 to “phase out supplying the defective inflators to fulfill existing contracts.”[18]  Worse yet, the newer versions of the airbags that are being installed today are expected to be recalled as well at a later date.  As Sen. Mark Nelson explains it: “What’s troubling here is that consumers are buying new cars not realizing they’re going to be recalled….these cars shouldn’t be sold until they’re fixed.”  Karl Brauer, a senior analyst with Kelley Blue Book added:  “This may be the first time in history where multiple automakers are selling brand new cars with a known, and potentially deadly defect….the scope of this recall continues to expand, and the number of vehicles impacted by it has already reached a level that will take years to resolve.” Automakers, with the permission of the federal government, have apparently decided to place their sales and profits above the safety of their customers.
 In addition, the refusal of automakers to use mass advertising to alert vehicle owners about the Takata recall campaign contradicts their standard industry practices.  Mass advertising – a comprehensive strategy that incorporates television, radio, print, the Internet and social media — is commonly used by automakers to market their vehicles to consumers, comprising millions of dollars in advertising expenditures each year. Although automakers may believe that they are saving advertising dollars by avoiding the use of mass advertising to alert vehicle owners about the recalled Takata airbags, perhaps they may re-consider their decision once the lawyers begin using mass advertising to represent the many disgruntled or injured consumers resulting from the recall.      Really, it would not be that difficult to create a mass advertising campaign where automakers could pool their resources to more quickly alert vehicle owners about the defective Takata airbags.   The U.S. Census Bureau, for example, has demonstrated the power of mass advertising in achieving a high response rate to the decennial census by incorporating a broad multilingual campaign that engaged different segments of the U.S. population.  Such a campaign would be highly beneficial in accelerating compliance with the Takata recall campaign. The mass advertising campaign should also alert new vehicle buyers if their new vehicles will include a Takata airbag, whether it is currently defective or will become defective in the near future.  Consumers have a right to know this information so that they can opt to purchase a different vehicle or perhaps delay their purchase altogether.
The Vehicle Owner:  Are vehicle owners just ignoring the alerts to replace defective Takata airbags?  Do they understand these notices? Or are they just indifferent to the recall campaign?  Of course, one cannot answer these questions conclusively without hard evidence, especially given that no mass advertising has been implemented yet and auto dealers have been given wide latitude by the NHTSA to comply with the recall campaign. However, assuming that vehicle owners remain non-complaint even though (a) they are aware of the Takata recall campaign, (b) are offered a loaner or rental car while waiting for a replacement airbag, and (c) replacement airbags are available, it seems that the federal government should take charge and force consumer compliance as it has done in the past with the use of safety belts and automobile safety inspections. In addition, some states are suspending driving privileges to ensure compliance with government programs like child support.  Consumer compliance, however, may not be the major impediment to the Takata recall program in the context of the weak support and corporate greed demonstrated by the automotive industry, as well as federal notices of encouragement that lack the force of law. 
One mysterious question that emerges about consumer reaction surrounding the Takata recall campaign is:   Where is the public outrage?  Indeed, where are the advocacy groups, such as Mothers Against Drunk Driving (MADD), that have been effective in mobilizing consumers, creating broad media coverage, and shaping legislative changes on important social or health issues?  Is the public just uninformed about the deadly consequences of defective Takata airbags, or has the public been sedated by the various philanthropic activities of automakers?  Corporate giants have long recognized the importance of community investment to insulate their reputations from the wrath of communities that have been impacted by their defective products or controversial policies.  Perhaps some of the corporate donations to communities – such as soccer stadiums or scholarships programs – should be shifted to support a broader mass advertising campaign that alerts vehicle owners about the recall campaign and availability of car rental programs.     
While NHTSA and automakers continue to waltz around the programs and policies that could substantially improve compliance with the Takata recall campaign, consumers will increasingly lose their patience and becoming increasingly fearful of being the next victim of the deadly Takata airbags. Rather than wait for replacement airbags to arrive, vehicle owners may be considering other options, such as:
  • Seeking a legal remedy if automakers refuse to provide a replacement vehicle
  • Stopping car payments until defective airbags are repaired or replaced
  • Starting a collective boycott against non-responsive automakers to obtain a replacement vehicle.
  • Lobby lawmakers to push for legislation to immediately stop automakers from installing defective Takata airbags in new and used vehicles, whether they are currently defective or will become defective in the near future.
  • Require automakers, dealers and rental companies to disclose to all buyers or rental customers whether a vehicle contains a Takata airbag that is currently defective or will become defective in the near future.
While NHTSA encourages vehicle owners to continue driving vehicles while they are waiting for replacement airbags, one attorney – Todd Walburg with Lieff Cabraser Heiman & Bernstein – has a different point of view. Mr. Walburg has sued many car companies on behalf of consumers and advises the owners of recalled vehicles “to stop driving the car immediately. Take it to a dealership and demand a rental car, because the safety of the owner and their families is at risk.  If they don’t provide a rental car, look into legal options.” [19] 

Takata:  What do you tell the company that started the forest fire?  At the very minimum, do not start more fires.  Ironically, Takata continues to manufacture airbags with the same defective inflator design, and U.S. automakers will continue to install these airbags until the year 2018 to allow Takata to fulfill its current contractual agreements. Concern for the deaths and injuries that may occur with this arrangement has taken a backseat to the need to fulfill business contracts with the approval of our federal government.   For unknown reasons, Takata became the favored supplier for automakers and has enjoyed a 30 percent market share of all airbag sales.[20]  While Takata and automakers were enjoying their successful relationship, no one seemed too concerned that the honeymoon could be threatened by a massive recall of Takata airbags.  Honda was the first to issue a recall of Takata inflators in 2008, while it took another five years (2013) for Takata to file a defect report about manufacturing problems with their airbags.  A year later (2014), NHTSA asked several automakers to recall vehicles with Takata airbags in hot and humid regions because of airbag ruptures occurring in Florida and Puerto Rico.[21] 
These milestones may seem reasonable given the complexities associated with the largest recall campaign in U.S. history.  However, a recent blogpost on the web site of Valient Market Research [22] revealed key information suggesting that Takata delays may have had an ulterior motive. As Daniel Gremke, the blogpost writer tells us:
  • Honda and Nissan, the two flagship customers of Takata, refused to financially bailout their longtime safety systems partner;
  • Takata repeatedly failed to accept legal and financial responsibility for the deaths and injuries resulting from ruptured Takata inflators, and instead blamed their car maker customers for failing to properly test the airbag inflators before production approval throughout the 2000-2012 time period;
  • Takata repeatedly manipulated inflator test data prior to submitting it to its OEM customers throughout the mid-2000’s. Despite concerns shared in internal memos by American Takata engineering executives about the Japanese practice of data falsification and manipulation, Takata continued this practice until its discovery several years ago.
  • After a highly respected German technical research firm – Fraunhofer Institute – confirmed the problem with Takata’s chosen propellant for the airbag, Takata publicly admitted that it would change the airbag’s propellant formula after 2018.
Given its obvious efforts to falsify the test data, it is possible that Takata’s foreign ownership shielded them from criminal prosecution by the U.S. Attorney General as occurred when Toyota hid its safety defects in 2014.  Interestingly, the delays associated with Takata’s refusal to accept responsibility for the deaths and injuries that its airbags have caused, coupled with the federal government’s reluctance to act more decisively in stopping the continued use of these airbags, have both given Takata ample time to populate increasingly larger numbers of U.S. vehicles with its defective airbags, thereby ensuring dependency on Takata well into the future. It seems incredible that the NHTSA would allow the continued installation of defective Takata airbags, especially when recognizing the current dismal airbag repair compliance rates by automakers; that is, because large numbers of vehicle owners are not getting their defective airbags replaced, what this business arrangement does is increase the number of time-sensitive land mines that will explode sometime in the future. In addition, many of these older vehicles will escape detection and repair since vehicle sales by individual owners are not being monitored very carefully.  We should all worry about the population of used vehicles, since the average age of vehicles on America’s roads is 11.4 years and expected to grow rapidly as new cars become less affordable.[23] 
Thus, it appears that no one in the automotive has been in a hurry to protect consumers from the defective Takata airbags.  On the contrary, current NHTSA policies and automaker practices appear to favor the continued sales of vehicles with known defective Takata airbags over the short and long-term safety of consumers.  In the meantime, the marketing of vehicles continues as usual while consumers are expected to accept the premise that they should blame a parts shortage for the deaths, injuries, and absence of rental cars that they are likely to experience. Are U.S. consumers so naïve, or will they take decisive action to change the course of the Takata recall campaign?
Suggestions to Facilitate the Takata Recall Campaign
As one of the largest recalls in U.S. history, it is reasonable to expect that the Takata recall campaign will take many years to achieve.  However, the length of time that it takes to achieve 100 percent compliance will require all participants to make aggressive efforts to change their behavior, programs and policies.   The following table summarizes the changes that I believe are needed to accelerate the Takata recall campaign.
PARTICIPANT
RECOMMENDED ACTIONS
Takata
·        Get the financial support needed from Japanese banks to expand capacity to repair all defective air bags
·        Stop using the defective propellant in any airbags, new and replacements
·        Allow third-party experts to monitor all future testing of airbag products to avoid falsification of test data
Automakers and dealers
·        Stop using Takata airbags with defective propellant formula
·        Disclose the use of Takata airbags to all vehicle buyers so they have the option to refuse the purchase of that vehicle
·        Offer rental cars to all vehicle owners waiting for airbag repairs – rentals that do not have any safety defects
·        Create a mass advertising campaign in multiple languages by pooling resources with other automakers to deliver a comprehensive message about the recall campaign
NTHSA
·        Stop Takata immediately from installing any airbags that include the defective propellant
·        Require automakers to provide rental cars to vehicle owners waiting for replacement parts, and publicize this benefit widely
·        Require new/used auto dealers to disclose the presence of Takata airbags to all consumers, regardless of whether the airbags are currently defective or not
·        Require vehicle inspections to include a check on compliance with the Takata recall campaign
Vehicle owners
·        Demand replacement vehicles and consider legal remedies if request is denied
·        Stop buying vehicles that include a Takata airbag with the defective propellant
·        Lobby lawmakers to create legislation with penalties to force Takata, automakers and vehicle owners to comply with the Takata recall campaign
·        Launch a high-visibility protest to expose non-responsive automakers
Inquiries or comments regarding this paper should be sent to Dr. Edward T. Rincon at edward@rinconassoc.com.  To learn more about Rincón & Associates LLC, please visit our web site at https://www.rinconassoc.com. 
ENDNOTES
—————————————–
[1]National Highway Traffic Safety Administration. Fact Sheet: Takata Recall History and Key Terms. https://www.nhtsa.gov/sites/nhtsa.dot.gov/files/documents/120916-fact_sheet-takata_recall_history_and_key_terms-tagged.pdf
[2]U.S. Department of Transportation. “U.S. DOT accelerates replacements of Takata air bag inflators.” Press release of December 9, 2016.  https://www.nhtsa.gov/press-releases/us-dot-accelerates-replacements-takata-air-bag-inflators
[3]Davis, Todd. “Who’s NOT on the list? Up to 40M more cars added to Takata air bag inflator recall.” Dallas Morning News, May 4, 2016.  http://www.dallasnews.com/business/autos/2016/05/04/who-s-not-on-the-list-up-to-40m-more-cars-added-to-takata-air-bag-inflator-recall
[4]Wire Services. “Takata air bag recall will end up affecting over 42 million vehicles.” Dallas Morning News, December 19, 2016. http://www.dallasnews.com/business/autos/2016/12/09/takata-air-bag-recall-will-end-affecting-42-million-vehicles
[5]Davis, Todd.  “Who’s NOT on the list? Up to 40M more cars added to Takata air bag inflator recall.”
[6]Pender, Kathleen. “Takata recall: Some drivers get free rental cars, for months.” San Francisco Chronicle, April 15, 2016.  www.sfchronicle.com/business/networth/article/Takata-recall-Some-drivers-get-free-rental-cars-7252027.php.
[7] Wire Services. “Takata air bag recall will end up affecting over 42 million vehicles.”
[8]Pender, Kathleen. “Takata recall: Some drivers get free rental cars, for months.”
[9]National Highway Traffic Safety Administration. “Effective Today: New Federal law for recalled rental cars protects consumers from vehicle safety defects.” Press release dated June 1, 2016.  https://www.nhtsa.gov/press-releases/effective-today-new-federal-law-recalled-rental-cars-protects-consumers-vehicle
[10] Wire Services. “Takata air bag recall will end up affecting over 42 million vehicles.”
[11]Davis, Todd.  “Who’s NOT on the list? Up to 40M more cars added to Takata air bag inflator recall.”
[12]Vlasic, Bill and Apuzzo, Matt.  “Toyota Is Fined $1.2 Billion for Concealing Safety Defects.”  New York Times, March 19, 2014.  https://www.nytimes.com/2014/03/20/business/toyota-reaches-1-2-billion-settlement-in-criminal-inquiry.html?_r=0
[13]Thanawala, Sudhin, Associated Press. “Volkswagen’s $1 billion deal on diesel cars gives buyback option for owners.” Dallas Morning News, December 20, 2016.  http://www.dallasnews.com/business/autos/2016/12/20/volkswagens-1-billion-deal-diesel-cars-gives-buyback-option-owners
[14]Reuters. “General Motors Settles Ignition-Switch Cases  GM case.”  September 6, 2016. http://fortune.com/2016/09/05/general-motors-settles-ignition-switch-cases/
[15]Dorman, Frank. “CarMax and two other dealers settle FTC charges that they touted inspections while failing to disclose some of the cars were subject to unrepaired safety recalls.”  Federal Trade Commission press release dated December 16, 2016.  https://www.ftc.gov/news-events/press-releases/2016/12/carmax-two-other-dealers-settle-ftc-charges-they-touted
[16]National Highway Traffic Safety Administration. “Effective Today: New Federal law for recalled rental cars protects consumers from vehicle safety defects.”
[17]Pender, Kathleen. “Takata recall: Some drivers get free rental cars, for months.”
[18]Isodore, Chris. “New cars being built with flawed Takata airbags.”  June 1, 2016.     http://money.cnn.com/2016/06/01/news/companies/takata-airbag-recall-new-cars/
[19]Pender, “Takata recall: Some drivers get free rental cars, for months.”
[20]O’Donnell, Paul. “Are you affected?  What you should know about the record-setting Takata air bag recall.” Dallas Morning News, May 6, 2016.  http://www.dallasnews.com/business/business/2016/05/06/what-you-need-to-know-about-the-takata-air-bag-recall-the-largest-in-automotive-history
[21]National Highway Traffic Safety Administration. Fact Sheet: Takata Recall History and Key Terms.

[22]Gremke, Daniel. “Takata’s Future: Implosion, Bail Out or Metamorphosis.” January 7, 2016.  http://valientmarketresearch.com/uncategorized/takatas-future-implosion-bail-out-or-metamorphosis/
[23] Valdes-Dapena. “Average U.S. car is 11.4 years old, a record high.”  http://money.cnn.com/2013/08/06/autos/age-of-cars/

Texas Rangers Stadium: Questionable Polling Practices in a High-Stakes Competition
You have got to be kidding.  On November 8, City of Arlington residents are expected to vote on a divisive ballot measure to finance the proposed $1 billion Texas Rangers Stadium. Meanwhile, campaign stakeholders have released a series of poorly designed, automated, low-cost polls to measure the public opinion on this important issue. What’s wrong with this picture?
With such high stakes consequences, one would assume that poll sponsors would want to support their campaign advocacy with a high-quality poll conducted by a polling company with a recognized track record. Poll sponsors may try to stack the deck to support their campaign objectives, but a reputable pollster with a good track record would not knowingly bias a study. Not everyone that conducts opinion polls, however, are reputable pollsters.  Indeed, the “shadow” polling industry includes many telemarketing firms, call centers and political operatives that have little or no training in survey practices or ethical conduct, and usually not active in professional polling organizations.
Each of the sponsored polls have reported different results, used varying methodologies, and were conducted by polling firms with varying reputations.  Only one of these polls –conducted by DHC Data — has been subjected to critical review by survey experts in local news stories and considered to be of questionable quality.  Interestingly, the polls sponsored by the Say Yes campaign and WFAA/Fort Worth Star-Telegram have not been critically analyzed by survey experts in local news reports. Because the results of these polls are likely to influence the voting behavior of Arlington city residents, I believe that each of these polls require some scrutiny as well. The reputation of a pollster is clearly important, but not as important as their polling methodology in a particular study.
I reviewed only one online report for the poll sponsored by WFAA and the Fort. Worth Star-Telegram, while relying on published news reports regarding the methodology of the other three polls. I discovered shortcomings in all polls, and would like to share my thoughts on their implications for polling accuracy and voting outcomes. My only objective here is to educate the public about good and bad polling practices — topics that I usually address in classes that I teach on survey research methods, mass communications research, and statistics. In addition, the information discussed should provide some help in deciding which poll deserves more of the public’s confidence.
1.      Sample Selection: Each of the polls reported that their target audience included likely voters in the City of Arlington. However, only one of the pollsters — Public Opinion Strategies — sampled landline and cell phone households since they used live interviewers to manually dial the numbers, as required by the FCC, which is likely to capture a more representative sample of voters.  DHC Data (for Save Our Stadium), however, relied exclusively on landline phones while Survey USA (for WFAA/Star-Telegram) relied primarily (76%) on landline phones and less on mobile phones. Good survey practice suggests that pollsters should rely less on landline telephones because their penetration has declined significantly in recent years and are more likely to capture older residents. A recent study by the Pew Research Centers explains the wisdom of placing more reliance on cellphone households in telephone-based surveys:
“Samples of adults reached via cellphone are much more demographically representative of the U.S. than samples of adults reached via landline. Consequently, replacing landline interviews with cellphone interviews reduces the degree to which survey data need to be weighted to be representative of U.S. adults. This in turn improves the precision of estimates by reducing the margin of sampling error. Perhaps not surprisingly, one major survey was recently redesigned to feature 100% cellphone interviewing.”  (The Twilight of Landline Interviewing,” Pew Research Center, August 1, 2016)
Thus, studies that rely primarily on landline telephone households may be “stacking the deck” by placing more weight on the opinions of older residents than the opinions of residents that depend more on cell phones, such as younger and ethnic minority residents.
2.      Exclusion of Demographics:  Without demographic information about the poll respondents, it is difficult to know how well the poll respondents represented the voting community. There is no good reason to hide this information other than to avoid scrutiny by other experts. Each of the studies tell us that their target audiences were likely voters in the City of Arlington, but only one of the polls (WFAA/Star-Telegram) provided demographic information for the respondents that could influence the survey outcomes – such as race, gender, and age.  For pollsters that do not disclose demographic information, we are left to wonder if these polls over- or under-represented particular segments of the community which could mispresent the polling results. None of the pollsters reported whether their polling results were weighted or adjusted to reflect the demographics of the voting community in the city of Arlington.
3.      Questionnaire Content:  Survey experts interviewed in news stories had mixed opinions about the one poll reviewed (Save Our Stadium), pointing to such problems as leading questions or long questions that would test the memory of any person. Campaign representatives on both sides have pointed to incomplete or misleading descriptions of the ballot measure as well.
4.      Data Collection Approach:  With the exception of Public Opinion Strategies (POS), the two other polling firms (DHC Data and Survey USA) opted to use the cheapest and least credible data collection approaches to collect opinions on this divisive issue: pre-recorded, automated telephone calls instead of live telephone interviews.  Automatic telephone calls have little credibility in the polling industry because they remove human contact, and do not provide any opportunity for clarification when respondents are confused. Automated telephone calls are often rejected by residents because they are associated with telemarketing firms that often annoy the public. Polling firms employ automated calls when they have limited time available, have a limited budget to fund live telephone interviews, or have limited resources to use live interviewers. Because FCC regulations prohibit automated calls to cell phone users unless they are manually dialed, polls using automated methods exclude nearly half of community residents who have only wireless devices but no landline telephones – a practice that systemically excludes younger residents and ethnic minority groups.

5.      Language offered:  Based solely on news reports about these polls, it appears that none of the pollsters offered a language other than English to collect their data. Why is this important?  Hispanics comprise 29 percent of Arlington city residents, while 36 percent of Hispanics are foreign-born and primarily Spanish-speaking.  Our past experience shows that 50 to 63 percent of Hispanics will prefer a Spanish-language interview because they find it easier to express their opinions. Unless their presence in the voting community is minimal, it makes little sense to exclude this strong base of baseball fans by offering only one language. Indeed, it is likely that the estimate of support for the new stadium could be under-estimated by this exclusion.
6.      Pollster’s Reputation:  The reputation of the polling companies was also discussed in news reports.  In my opinion, Public Opinion Strategies utilized the most credible polling methodology since all interviews were conducted by telephone with live interviewers, their two polls included landline and cell phone households, and the company has a long history of public opinion polling.  DHC Data, however, was characterized in news reports as having a low visibility, no web site, and questionable experience as a pollster. Its owner, however, claims to have conducted several polling studies in past years.  Survey USA – who conducted the WFAA/Ft. Worth Star Telegram poll, was also described as having a solid polling history. Interestingly, survey experts only scrutinized the poll conducted by DHC Data, while the polls conducted by the other two polling firms received praise for their track records but little criticism of the polling techniques used in the Texas Rangers campaign.  It is a risky practice to avoid scrutiny of a pollster’s practices because they have a great reputation.
In summary, the most recent polling results are summarized below:
·        Save Our Stadium poll by DHC Data:  38% support, 46% oppose, 16% undecided
·        Say Yes polls by Public Opinion Strategies:
o   Sept. 23-25:  54% support, 40% oppose, 6% undecided
o   Oct. 14-15:  56% support, 37% oppose, 7% undecided
·        WFAA/Ft. Worth Star Telegram poll by SurveyUSA: 42% support, 42 opposed, 16% undecided
Ultimately, the election scheduled for Nov. 8  will be the final word on which pollster provided the best picture of how Arlington residents feel about the Texas Rangers Stadium issue.  Based on the information evaluated thus far, I believe that the polling results by Public Opinion Strategies for the Vote Yes campaign – 54-56 percent supporting the stadium referendum – presents the most accurate picture of the actual voting outcome.  Why?  Primarily because they used human beings to conduct the interviews and included both landline and cell phone residents in their study. The poll was not without its own shortcomings since it did not describe the respondents’ demographic attributes, and may have excluded Spanish-speaking and younger voters by over-relying on landline telephone households.  Nonetheless, I believe that their polling practices and results are more deserving of the public’s confidence in comparison to the other polls. 
Thus, poll sponsors that invest minimally in opinion polls and approve of practices that are known to bias polling results do a disservice to the voting community.  Since the results of these polls are likely to positively or negatively influence the actual voting outcomes, it is imperative that pollsters utilize recognized best practices in polling and also disclose demographic information about the respondents in their polls that can be used to evaluate potential sources of bias stemming from their sampling or data collection methods.