Pharmacies, Not Local Public Officials, May Ensure Race Equity in Vaccination Rates

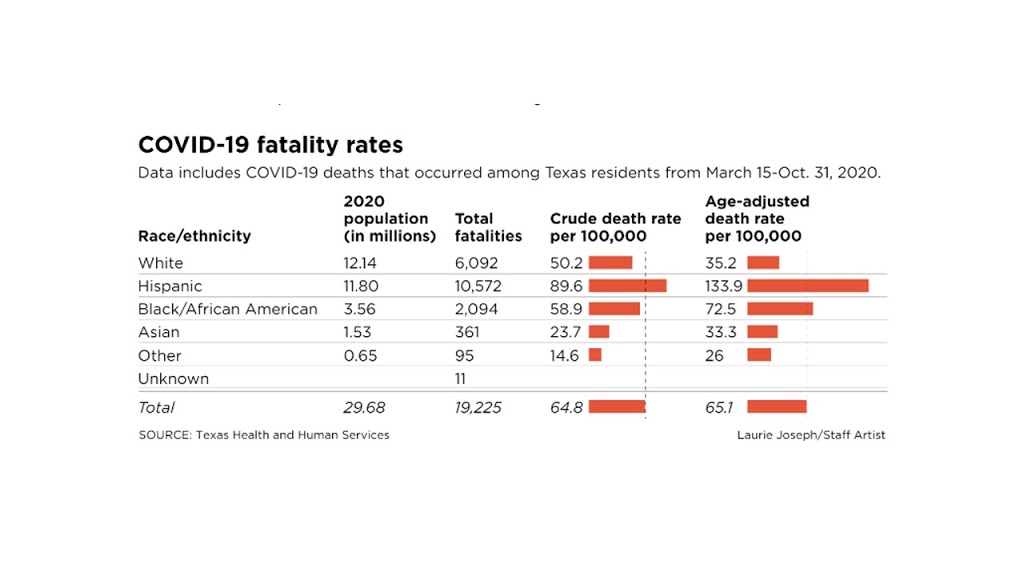
The release of a long-awaited report on Texas COVID-19 facilities by race-ethnicity was shocking.[1]Not because our community was unaware of race-ethnic disparities in vaccination rates but rather the large size of these disparities in Texas.  As the numbers for age-adjusted death rates per 100,000 revealed, Hispanics were nearly four times more likely to die (133.9) from the coronavirus than whites (35.2), while Blacks (72.5) were twice as likely to die as whites.  Asian death rates (33.3) were slightly lower than whites.

Texas State Rep. Shawn Thierry along with other lawmakers have been advocating for the release of this report in order to mobilize statewide efforts to target vulnerable groups like Blacks and Hispanics, although state officials have been reluctant to act more aggressively. In response to the release of this report, Rep. Thierry explained that the findings underscored the need to target resources to communities of color, especially since other data shows that white residents are getting vaccinated at higher rates than Blacks and Latinos. [2]

Given the high death rates for Latinos and Blacks, it is especially surprising that Texas state officials recently threatened to withhold vaccine doses that were allocated to Dallas County if they proceeded with a plan to target vaccinations to zip codes that included higher numbers of vulnerable Black and Latino residents.

Indeed, efforts to block targeted interventions to vulnerable communities contradicted recommendations by the National Academy of Sciences that recommended that “priority be given to ‘people who are considered to be the most disadvantaged or the worst off’ as defined by measures such as the Social Vulnerability Index created by the Centers for Disease Control and Prevention.” [3]

The announcement that the Biden administration will begin shipping vaccines to pharmacies throughout the U.S. was a major sight of relief for two reasons.  First, it minimizes the involvement of local politicians in the equitable distribution of the vaccines who have largely bungled the job in its communications, registration and distribution – resulting in higher vaccination rates of higher-income whites than lower-income Blacks and Latinos.  Texas politicians will also have less influence in threatening to withhold vaccines to jurisdictions that want to more aggressively vaccinate the more vulnerable communities of color.

Secondly, pharmacies are much easier to access for the elderly, Blacks and Latinos who encounter more barriers in registrations and obtaining vaccinations.  The Mega Centers are innovative in terms of providing a centralized location to vaccinate thousands of residents more rapidly; however, not all residents can travel to these Mega Centers or wait in line for hours during cold weather without access to restrooms or food.  The distribution of vaccines by pharmacies will not solve all the problems experienced thus far but should lead to significant improvements.

Given the gravity of the higher death rates for Texas Latinos and Blacks, it is disturbing to learn that Texas state officials are delaying any targeted interventions for these groups for several months.  Even more disturbing is that state officials threatened to withhold vaccine doses to Dallas County for attempting to follow the science by targeting the more vulnerable groups of Black and Latino zip codes.  The State of Texas deserves no praise for their callous response to the lives of its Black and Latino residents.


Reference Notes


[1]Morris, A.  (2021, February 2).  Report highlights disparities – but proposals targeting effects on minorities months away.  The Dallas Morning News, Accessed at: 

[2]Ibid.

[3]Cited in Warren, R.C. D.D.Sl, Dr.PH.H., M.Div., Forrow M.D., L., Hodge Sr., D.Min., Ph.D., and Truog, M.D., R.D.  (2020, November 26).  Trustworthiness before trust – COVID-19 vaccine trials and the Black community.  The New England Journal of Medicine.  Accessed at: https://www.nejm.org/doi/full/10.1056/NEJMp2030033      

Why Do Dallas-Area Public Officials Keep Fumbling the Ball on Programs Targeted to Multicultural Communities?

 Let’s give credit where credit is due. Dallas County and City of Dallas public officials have not won any accolades recently for decisions regarding programs that impact the quality of life for its multicultural community.The recent fiasco surrounding the distribution of the COVID-19 vaccine is the most recent example, but two other recent programs also come to mind – the Census 2020 Campaign and the lingering presence of food deserts in South DallasAs I will argue, these programs have one important thing in common that has posed a barrier to their success: the absence of quality research to guide decisions regarding public programs that are targeted to Black and Latino residents.

In 2020, I published a book entitled “The Culture of Research” that discusses the importance of conducting sound research in culturally and linguistically diverse communities and the consequences to decision making when such studies are missing or poorly conducted. Following are some insights derived from this book that should help the reader understand how sound research with multicultural communities could have produced improved outcomes in the management of the local COVID-19 vaccination program, the Census 2020 Campaign, and solving the mystery surrounding the persistence of food deserts in South Dallas.

COVID-19 Vaccine Awareness, Registration and Distribution

The local confusion and mismanagement associated with the COVID-19 vaccine distribution can be traced originally to the absence of guidance and transparency at the federal level, and the related decision by the previous administration to allow states to define their own independent strategies with a minimal financial support from the federal government.

Nonetheless, the COVID-19 vaccine distribution dilemma in Dallas County, Texas presents a good case study on decisions that public officials in urban communities should not make.   Indeed, the series of inconsistent and questionable decisions resulted in considerable public confusion and frustration with vaccine registrations, availability and distribution. Some of these missteps included the following:

  • Contradictory messages from county and city public officials;
  • Over-reliance on an Internet strategy to inform and register residents, many who lacked online access or own a computer, or were not comfortable with technology;
  • Inconsistent support in Spanish and other languages;
  • Placement of testing and vaccination sites in higher income while providing limited access in the more vulnerable areas; and  
  • Transportation barriers that prevented some residents to travel to testing or vaccination sites.
These missteps have resulted in higher numbers of white, higher-income residents getting vaccinated rather than the targeted, more vulnerable Black and Latino residents in the lower-income areas of South and Northwest Dallas. 

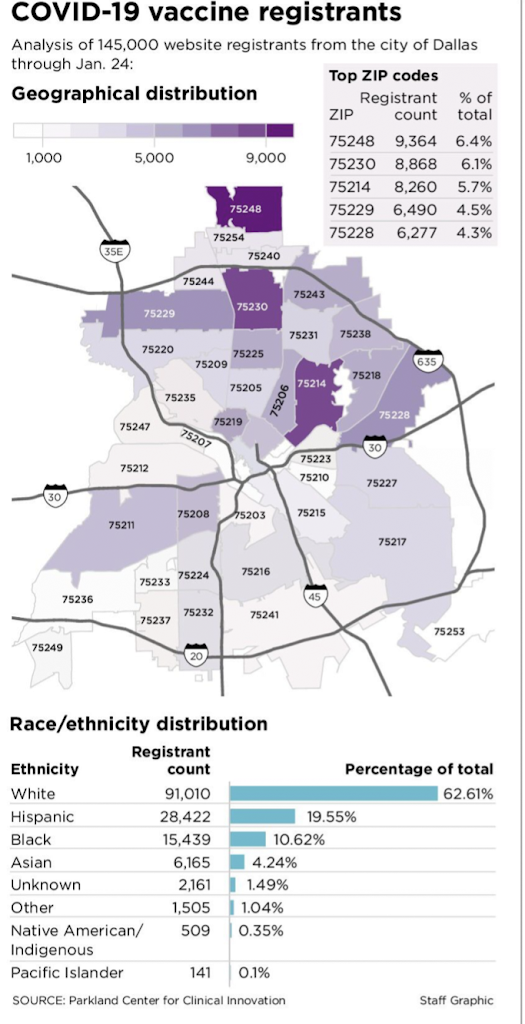
Figure 1:

Figure 1, published recently in The Dallas Morning News, clearly illustrates this pattern: [1]  whites comprised 62.2 percent of all persons vaccinated while representing 28.2% of the County population; Hispanics represented 19.5 percent of those vaccinated while comprising 40.8% of the population; and Blacks comprised 10.6 percent of those vaccinated although they represented 22.3% of the county population.  These disparities persist despite recent efforts by public officials to communicate more directly with civic leaders, churches and community organizations to improve vaccination rates for Blacks and Latinos in the South and Northwest part of Dallas.

The problem associated with vaccine distribution in communities of color is deeply concerning because they are the most likely to experience the more serious medical consequences from the coronavirus.  Importantly, these missteps in decision making could have been avoided with communications that were better coordinated by public officials and engagement of experts with significant experience engaging multicultural persons. 

The decision to use an Internet vehicle for the vaccination campaign is very likely the reason that white, higher income residents continue to be more successful in getting vaccinated. Although some public officials supported the idea of targeting zip codes in South Dallas that included some of the most vulnerable Black and Latino residents, the Texas State Health Department[2]immediately issued a threat to withhold vaccine doses allocated to Dallas County if the targeting was implemented.  This threat was a direct contradiction to recommendations by the National Academy of Sciences that support vaccine community intervention programs that are targeted to the most vulnerable communities. [3]  Thus, Dallas County and City of Dallas public officials learned the hard way that launching a public vaccination program in linguistically and culturally diverse communities require less reliance on technology and more reliance on outreach efforts that take the vaccines to the residents.  Ironically, while the state threatened to withhold vaccine doses if local officials employed a zip-code targeting approach in South Dallas, the use of an Internet strategy as the primary form of communication accomplished the same outcome by vaccinating higher numbers of white, higher-income residents who resided in the northern parts of Dallas County.

South Dallas Food Deserts

Why have mainstream supermarkets avoided South Dallas food deserts that are populated by lower-income Blacks and Latinos?  [4]This question inspired me to conduct a geospatial analysis using crime, demographic and supermarket expenditure data to examine the common reasons cited by supermarket executives to explain the avoidance of communities like South Dallas – such as high crime, low population density, lower household median income and insufficient food expenditures.  The study revealed that crime patterns were often inflated by previous investigators and news stories, and that the annual food-at-home expenditures in several food deserts in South Dallas were adequate to sustain the annual sales of a mainstream supermarket.  Flawed crime analyses, stereotypes of urban retail, and an apparent disdain for Black and Latino customers appeared to drive site selection decisions in South Dallas.

Over the past two decades, the City has floundered millions of taxpayer dollars on ill- conceived investments that failed to produce positive changes in the supermarket options for this community. Worst yet, a market demand study of community residents – a traditional practice to measure supermarket opportunities — has never been conducted in South Dallas. Such a study would have provided supermarket and site selection executives the statistical evidence needed for an investment decision. In the meantime, South Dallas residents will be forced to continue shopping outside of their community for healthy, affordable food or visit the less desirable dollar stores.  Once City public officials decide that the South Dallas community is deserving of a high-quality supermarket experience, a professional, high quality market demand study is the best approach for making this a reality.  If supermarket redlining practices continue in South Dallas despite solid evidence of its retail potential, it might be a good idea to recruit a supermarket chain from outside of Dallas County or Texas that reveals a greater interest in serving Black and Latino consumers in urban communities. 

The Census 2020 Campaign

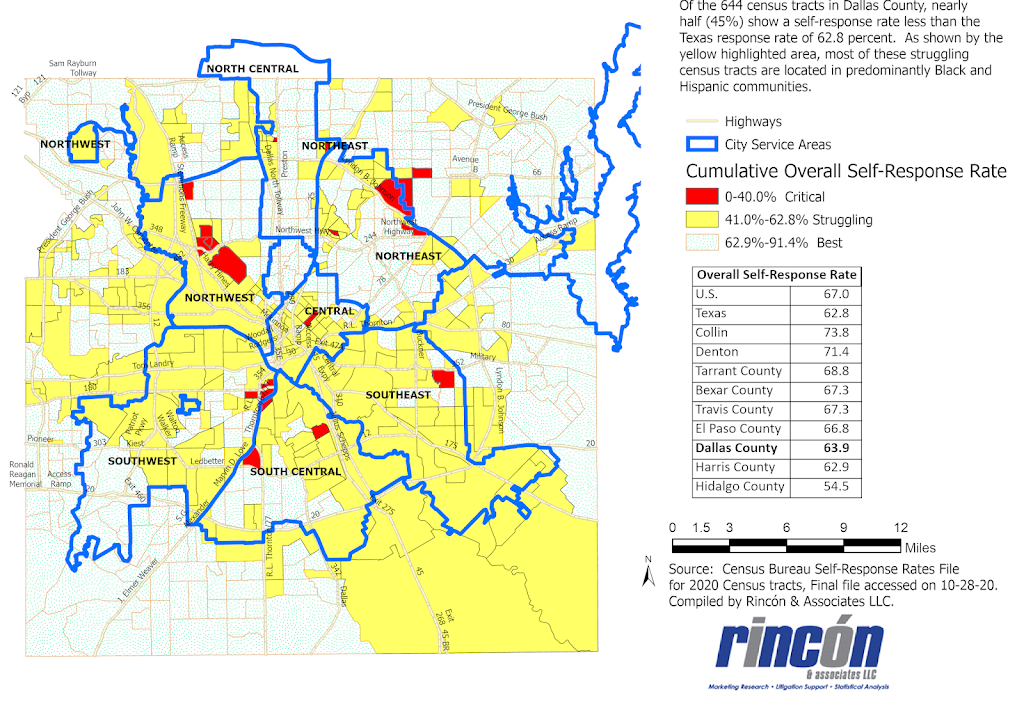
In January 2020, Dallas County and the City of Dallas funded a $1.9 million Census 2020 Campaign to provide a comprehensive strategy to boost response rates in hard-to-count communities that were populated by lower-income Blacks and Latinos. The team selected to conduct the campaign submitted a report summarizing the multitude of campaign activities that they conducted from February to August of 2020 to target these HTC communities.  To monitor progress on this campaign, I produced maps on a monthly basis that illustrated the cumulative self-response rates by census tracts that were provided by the Census Bureau.  Figure 2 below shows that the final self-response rates reported by the Census Bureau were decidedly lower in the southern and northwest parts of the city where HTC Blacks and Latinos resided.  In fact, the table of Overall Self-Response Rates indicates that Dallas County ended with one of the lowest self-response rates (63.9%) compared to other large Texas counties.  Consequently, the Census Bureau was required to deploy many more field interviewers in order to minimize the potential population under-count, an especially difficult task during the pandemic.  Despite its best intentions, the Census 2020 Campaign funded by the County and City appeared to fall short of its intended goal in hard-to-count communities and will likely lead to the loss of millions of federal dollars for local programs. Although the pandemic posed a barrier to response rates during this period, the burden on Dallas County was likely similar for all other counties considered here.

                 Figure 2: Dallas County 2020 Self-Response Rates by Census Tract and City Service Area

Part of the challenge in completing the Census 2020 questionnaires can be traced to the reliance that the Census Bureau placed on using an online survey as their major data collection strategy. In past censuses, the Census Bureau relied primarily on a mail questionnaire, while data collection for the annual American Community Survey has utilized a mixed mode strategy that included mail questionnaires, telephone interviews, personal interviews and online surveys.  Not surprisingly, Black and Latino respondents to the American Community Survey have opted for telephone and personal interviews more often than whites or Asians, while online surveys were the least chosen option.

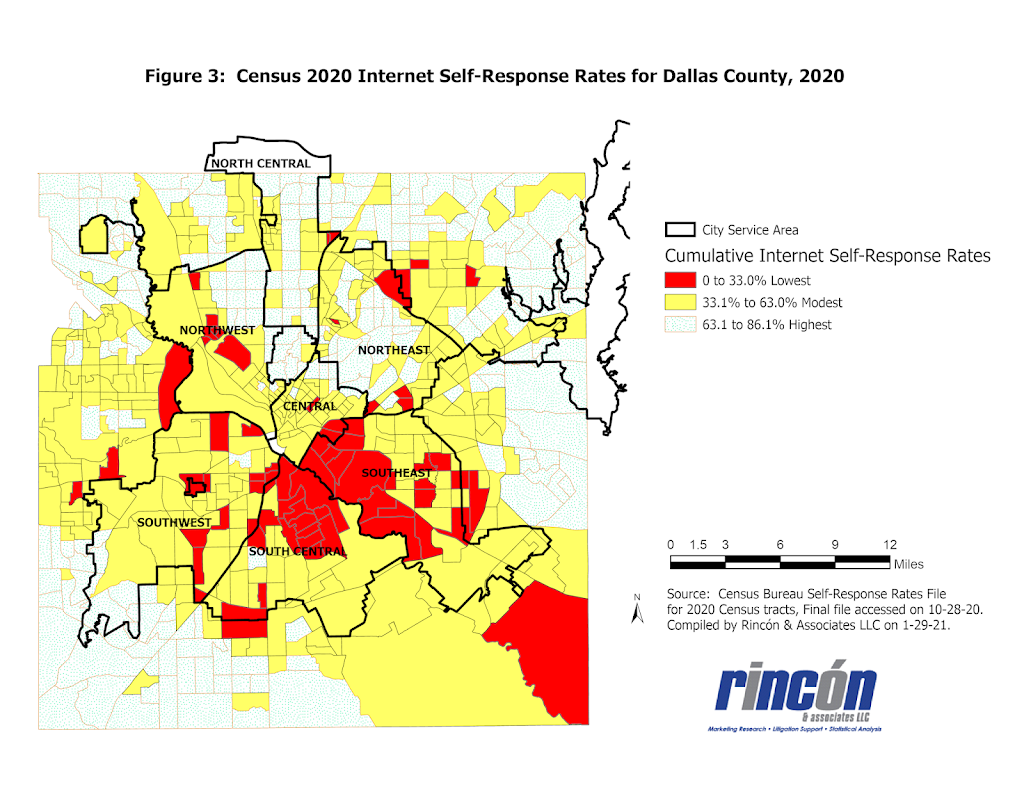
Figure 3 below presents the percentage of Dallas County households that completed the Census 2020 using an online survey.  The map presents the cumulative Internet self-response rates for the 2020 Census as of October 28, 2020.  Of the seven City Service Areas (CSAs), the Central, Southeast, South Central, Southwest and Northwest CSAs are populated primarily by lower income Blacks and Latinos. It is clear that these CSAs included census tracts (highlighted in red) with the lowest online response rates, while the numerous other census tracts (highlighted in yellow) showed modest online response rates.  The highest online return rates were realized for census tracts in the northeast and north central CSAs that were populated primarily by white, higher-income residents.


Throughout 2020, public officials in Dallas County and City of Dallas were aware of the poor performance of the Internet to encourage poor Blacks and Latinos to complete the 2020 Census.  Why then was the Internet the main vehicle used for communications related to COVID-19 vaccine awareness, registration and distribution?  Good research and multicultural expertise would have been beneficial to decision makers during this period.

Based on my past 45 years of experience in conducting surveys of multicultural populations, it is my opinion that the Census 2020 Campaign sponsored by Dallas County and City of Dallas was not guided by the best expertise regarding the strategies for successfully engaging multicultural population segments in surveys and the biennial census.  If it had been, Dallas County might have experienced a higher ranking in Census self-response rates in comparison to the many Texas counties that did not allocate any funding for a Census 2020 campaign.

Some Concluding Thoughts 

The challenges facing public officials to ensure a satisfactory quality of life for all community residents have become more complex and will require careful planning using the best expertise in understanding and engaging culturally and linguistically diverse communities.  Public officials must resist the temptation to take the path of least resistance by overlooking or dismissing the need for solid research to guide decisions that impact the quality of life of multicultural residents. Dallas County and City of Dallas public officials learned the hard way that engaging culturally and linguistically diverse residents is a complex task that requires multicultural expertise and support from community organizations. As the population of urban areas like Dallas County continues to grow and evolve demographically, the challenges to respond more effectively to important community needs and events will become more challenging.  Let’s hope that public officials will be better prepared to respond.


Reference Notes

[1] Garcia, N. and Jimenez, J. (2021, Jan. 28).  White Dallas residents outpace Blacks, Hispanics in registering for COVID vaccine.  Dallas Morning News, Accessed at:  https://www.dallasnews.com/news/public-health/2021/01/29/white-dallas-residents-outpace-blacks-hispanics-in-registering-for-covid-vaccine/

[2] Choi, J. (2021, Jan. 21).  Texas threatened to reduce vaccine supply to Dallas County over plan to focus on ‘vulnerable’ ZIP codes.  The Hill.   Accessed at: https://thehill.com/homenews/state-watch/535294-texas-threatened-to-reduce-vaccine-supply-to-dallas-county-over-plan-to

[3]National Academy of Sciences, Engineering and Medicine (2020). Framework for equitable allocation of COVID-19 vaccine. Washington, D.C.: National Academy Press.

[4] Rincón, E.T. and Tiwari, C. (2020, March 23). Demand metric for supermarket site selection:
 A 
case study. Papers in Applied Geography,  Accessed at: https://doi.org/10.1080/23754931.2020.1712555

Careless Decision Making Creates Race-Ethnic Disparities in Distribution of COVID-19 Vaccine


The recent story in The Dallas Morning News was clear and disturbing: 

”COVID vaccines at Fair Park aren’t going to Black, Latino residents as officials hoped” [1] 

The story chronicles the missteps in public communications efforts to schedule large-scale vaccinations to historically disenfranchised neighborhoods, which are mostly Black and Latino and below Interstate 30 – groups that have experienced a higher number of illnesses, hospitalizations and mortalities during the pandemic.  Instead, however, the thousands of residents that showed up for the vaccinations at Fair Park were mostly white North Texans from higher-income neighborhoods following mixed messages to the public – many showing up in their Mercedes, Infiniti and BMW automobiles. 

Dallas City Mayor Eric Johnson blamed County Judge Clay Jenkins for the confusion generated by the announcement to register online with the county to receive a vaccine appointment at the South Dallas Mega Center – an announcement that was apparently not coordinated with the Mayor’s office. Word of mouth spread rapidly that an appointment was not needed for residents 75 and older – which left thousands of others on a waiting list and encouraged many out-of-town residents to show up for a vaccine.  County officials pointed out that a significant number of residents who showed up were able to access an unsecured web link that allowed them to book an appointment, regardless of age or status.  Other residents who showed up also pointed to emails received from the county encouraging them to sign up for an appointment.

Interestingly, Dallas County was not prepared to release a demographic profile of those that received vaccinations, a report that would have been very useful in evaluating the extent of the exclusion of more deserving Black and Hispanic residents in the targeted community.  As an apparent after-thought to expand access to the intended Black and Hispanic residents,  Jenkins and his staff began reaching out to leaders in those communities, including elected officials, faith leaders and other organizations that work in communities where the coronavirus was most prevalent.

The vaccine distribution fiasco in Dallas County is not an isolated one as many communities throughout the U.S. are struggling to coordinate the vaccinations using a confusing set of federal guidelines that are implemented inconsistently thoughout the nation.  In a previous blogpost, I had warned about potential problems that could complicate the distribution of the vaccines once they became available.  For example:

·        The Center for Disease Control decided to exclude Blacks and Hispanics from the category of “high-risk” groups, thus reducing their priority level for intervention strategies. Why?  Because the CDC concluded that the high virus rates are not due to genetics, and they want to avoid stigmatizing these groups as “COVID carriers.” [2]

·        Race-ethnic information is missing for many of the cases, hospitalizations and mortalities recorded for COVID-19, which obscures the accurate reporting of this information for Black and Hispanic communities – a consequence of lax mandates for recording race-ethnic information. The absence of this information obscures the true picture of community spread of the virus. [3]

·        Access to testing sites in states like Texas is problematic since these sites are more commonly located in white communities than the more vulnerable Black and Hispanic communities. [4]

It is also disturbing to learn that states like Florida have relaxed the requirements for vaccine eligibility by allowing anyone over the age of 65 years to obtain a vaccine, which has encouraged many tourists and out-of-town residents to drain the vaccine supplies at the expense of more deserving local residents.

In the case of Dallas County and the City of Dallas, it was unfortunate that better coordination was not in place to implement such an important vaccine intervention program at the Fair Park Mega Center.  However, even if the communications had been better coordinated, there is still one important tactical decision that could have produced a different outcome.

In my opinion, it was a major mistake to rely primarily on a web-based strategy to encourage Black and Latino residents in the targeted communities to register for the Mega Center vaccination. From their recent experience to encourage response rates to the Census 2020, both Dallas County and City of Dallas officials were aware that Black and Latino residents, especially immigrants, were excluded in large numbers from completing the Census questionnaire which also primarily relied on the Internet.  Our past research in multicultural communities confirms that Blacks and Hispanics are more likely to respond by telephone, mail and personal contacts when completing surveys and Census questionnaires but least likely to respond by using the Internet. Lastly, a Census population pyramid easily illustrates that a much larger proportion of whites are concentrated in ages 65 and older than Hispanics or Blacks – which would provide whites a distinct advantage when using eligibility criteria based on age alone.

For damage control, Jenkins reportedly began outreach to community elected officials, faith leaders and other organizations in the targeted zip codes – an approach that should have been followed initially. Whether by intent or just careless decision-making, Mr. Johnson was correct in stating that the county was “promoting a system that gave preferential treatment” – that is, to white, higher-income residents who were not the intended target audience of the Mega Center.

With COVID-19 vaccinations, there is less room for error in the fair distribution of a life-saving solution.  Let’s hope that public officials agree to improve the coordination of public vaccination campaigns by improving their communication strategies in culturally diverse communities.


Reference Notes


[1]Garcia, N. and Bailey, E. (2021, January 14). COVID vaccines at Fair Park aren’t going to Black, Latino residents as hoped.  The Dallas Morning News.  Accessed at: https://www.dallasnews.com/news/public-health/2021/01/14/dallas-mayor-eric-johnson-blasts-county-after-walkups-allowed-at-covid-19-vaccine-mega-site/

[2] Rincon, E.T. (2020, July 30) CDC blunders in excluding communities of color among high risk groups for COVID-19. https://www.rinconassoc.com/cdc-blunders-in-excluding-communities-of-color-among-high-risk-groups-for-covid-19

[3] Rincon, E.T. (2020, April 16). Missing race-ethnicity data complicates COVID-19 mortality counts, but the solution is simple. Accessed at: https://www.rinconassoc.com/missing-race-ethnicity-data-complicates-covid-19-mortality-counts-but-the-solution-is-simple

[4]Fanning, R. (2020, May 29). Across Texas, black and Hispanic neighborhoods have fewer coronavirus testing sites. Texas Standard. Accessed at: https://www.texasstandard.org/stories/across-texas-black-and-hispanic-neighborhoods-have-fewer-coronavirus-testing-sites/

Final Post-Mortem on the Texas Latino Vote in the 2020 Election
 

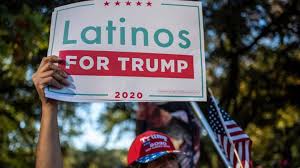
In the several post-mortems of the 2020 election, one key question has remained unanswered:  Are Latino voters really embracing Donald Trump — the same guy that referred to Latinos  as rapists and criminals, separated immigrant children from their families, accused of sexually assaulting several women, and referred to soldiers who lost their lives in battle as “suckers and losers”?  Because Trump was able to capture a higher percentage of Latino votes in Florida and South Texas compared to the 2016 election – various journalists and political pundits signaled an alarm bell suggesting that the future of the Democratic Party in Texas and Florida was in peril. 

It is curious that these limited Trump victories were portrayed as an  existential crisis for the Democratic Party, especially in light of CNN exit polls showing that U.S. Latinos  overwhelmingly supported Biden (66%) over Trump (32%) [1] — an outcome, by the way, that matched Latino support for Hillary Clinton in 2016. The following statements illustrate the warnings that accompanied Trump’s victory in South Texas:

“That erosion in an area considered a Democratic stronghold – is a warning sign to the party as it tries to flip the state.  It also serves as a stark reminder that the Latino vote is diverse, especially in a state like Texas. And that Democrats cannot take it for granted.” [2]

“And Trump, instead of being a complete drag on Cornyn, turned in eye-popping numbers in heavily Hispanic counties in South Texas.” [3]

“…such Hispanics joined conservative voters in urban and suburban areas to ‘deliver the message that life, liberty, law and order, Texas values and our Second Amendment rights are their top priority.” [4]

Especially interesting were the various attempts to explain the motivations for Trump’s newly found success among Latino voters in South Texas and Florida. To explore these motivations, reporters from the New York Times,[5] CNN [6] and Dallas Morning News [7] captured a variety of subjective impressions, or theories, from interviews with local legislators, community leaders, academics, and Hispanic voters. Following are seven distinct “theories” expressed by these stakeholders as justification for supporting Donald Trump along with factual information that we believe casts some doubt on these theories.

·       The Jobs Theory:  Concerns were raised that abolishing ICE would hit home to many Latinos that worked in homeland security and as Border Patrol agents, and also threaten jobs in the oil and gas industry. However, a 2019 report on the South Texas economy issued by the Texas State Comptroller’s Office [8] reported the following employment picture: (a) the number of jobs in South Texas related to justice, public order and safety activities were 29,654, representing 2.9 percent of all jobs in the region, (b) the four military installations in the region provided 41,044 jobs which represented 6.5 percent of all military jobs in Texas, and (c) 4,794 jobs or 0.57 percent of all jobs in the region were concentrated in the oil and gas or petroleum and coal products manufacturing industries. Taken together, these three industries accounted for a relatively small percentage (9%) of all jobs in the South Texas region.  Moreover, the oil and gas industry in Texas had already lost 51,000 jobs due to steep declines in demand and prices resulting from the pandemic that occurred under the watch of the Texas Republican administration.[9]  The large presence of military jobs may suggest a heightened sense of loyalty to the current president; however, did this sense of loyalty change when Donald Trump publicly disparaged military leaders, heroes and soldiers?

·       The Shared Values Theory: Some Latinos believed that Republicans shared similar values with Hispanic culture related to family, life and religious freedom. Trump’s family values are questionable given the numerous allegations of sexual assaults on women. And while Hispanics may value pro-life or anti-abortion policies, it is noteworthy that, according to a CDC 2016 report on statewide abortions,[10] Hispanic women nevertheless reported 20,667 abortions or 38.7 percent of all abortions in Texas. Regarding religious freedom, some Hispanics felt that Trump “brings God to our country” and values religious freedom.  Yet Trump has publicly voiced his intolerance for people of different religions, such as Muslims.

·       Communications Theory: Trump was described as a plain speaker. Indeed, Trump has managed to use plainly worded insults and profanity towards women, Latinos, Blacks, the disabled, athletes and war heroes. Trump also uses plain language when addressing public policy issues because his knowledge is very limited.

·       The Macho Theory: To some Hispanics, especially males, Trump’s macho style was appealing. Machos tend to be authoritarian and domineering, lack emotional investment, and believe that women should be subservient to males.  Considerable research, however, regarding Hispanic family dynamics confirms that Hispanic women are the primary decision-makers in the typical Hispanic household. [11]

·       The Exploited Theory: Several Hispanics believed that Democrats took them for granted while Republicans gave them a voice.  This theory has merit since the Democratic campaign in Texas was missing in action until the final week of the 2020 election, while Republicans launched aggressive campaigns in Florida and South Texas to capture the Latino vote.  Nonetheless, the South Texas region remains one of the poorest regions in Texas and has progressed little economically under the Republican leadership over the past decade.

·       Law and Order Theory: Trump was believed to support the police, law and order, and against defunding the police. But Trump publicly praises white supremacists and encourages supporters to use violence against Biden supporters and current government officials such as Michigan Gov. Gretchen Whitmer.  During the Trump administration, the number of hate crimes reported by the FBI have increased as well [12] [13]

·       Socialist Theory:  In Florida, Republicans utilized social media, outdoor parties and churches to promote the false message that Joe Biden was sympathetic to socialist dictators like Hugo Chavez and Fidel Castro – which Cubans and Venezuelans strongly disliked. Despite being false, however, the strategy was successful in creating stronger support for Trump in Florida.


While these theories are interesting, one should keep in mind that they are merely subjective impressions of Trump’s appeal that should not be generalized to Hispanics in South Texas, Florida or other communities.  Nonetheless, two disturbing attributes seem to emerge after reviewing these “theories:” a departure from reality and a distinct level of gullibility. That is, Latino Trumpers reveal a tendency to reject the facts related to an issue and seem easily deceived by the myths and distortions of the truth promoted by the Republican Party – attributes that are common among general Trump supporters. The gullibility attribute in Latinos stems from a general tendency to be more trusting of others than non-Latinos, although trust in government has clearly declined in recent years. Immigrants with limited English-speaking skills are more likely to trust Spanish-language media that they are better able to understand. Like the elderly, less acculturated Hispanics are less likely to be suspicious of the many scams and telemarketers that contact households on a daily basis and are often victimized according to annual fraud reports by the Federal Trade Commission.  During 2011, 13.4 percent of Hispanics were victims – almost 50 percent higher than the rate for non-Hispanic whites.  [14] Sadly, Spanish-language media is frequently used as the vehicle to victimize Hispanics, a practice that was successfully utilized by Republicans in Florida. Republican campaign strategists probably discovered these attributes early in the 2020 campaign and utilized it to their advantage in Florida, Texas and perhaps other communities. The ability to identify communities of Latinos that fit the Latino Trumperprofile is a clear advantage for the Republic Party, especially in communities that the Democratic Party chooses to ignore.

Despite these two victories, there is reason to believe that Biden did not lose Texas due to weak Latino support from the South Texas region.  To understand this point, let’s first review some basic information about the voting population in South Texas.

Profile of South Texas

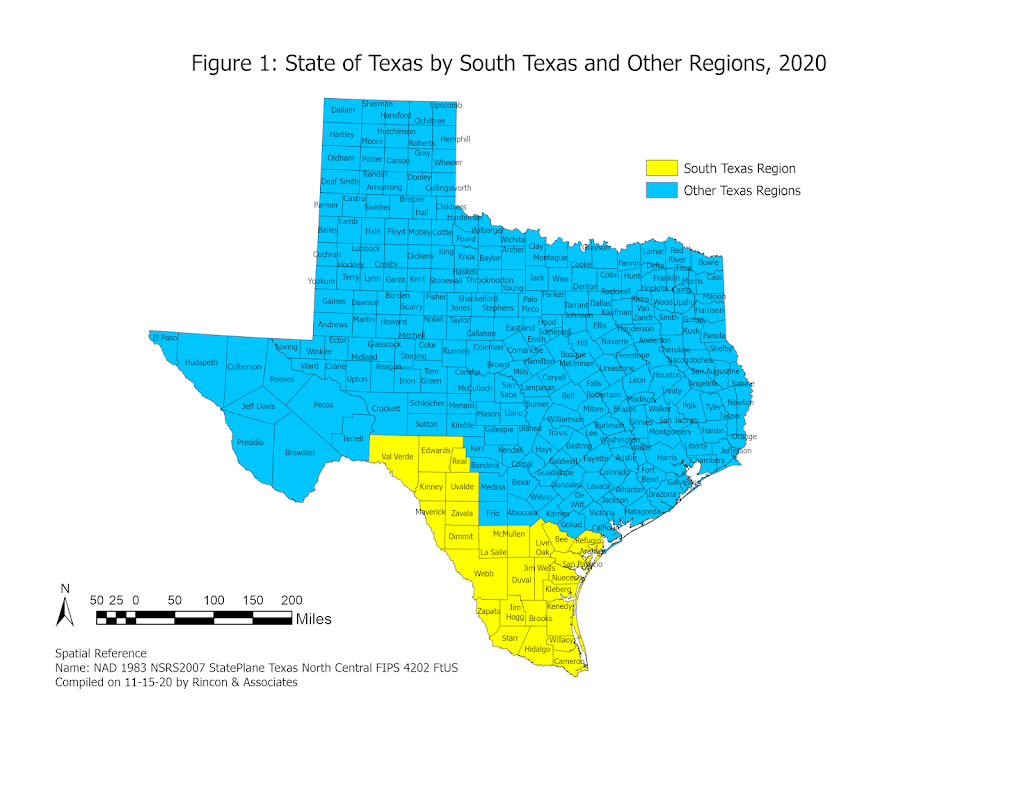
To understand the voting outcomes in South Texas during the 2020 election, it is helpful to first understand some of the demographic and economic characteristics that distinguish this region from the state’s population. We will summarize some of the information provided in a summary report of the South Texas region by the Texas State Comptroller’s Office.[15]  The South Texas region includes 28 counties as shown by the yellow highlighted area in the following map (see Figure 1 below):
The 2019 estimated population for South Texas was 2.4 million, representing 8.4 percent of the total population in Texas.  Between 2010 and 2019, the region has grown more slowly (7.4% rate) than the state’s growth rate (15.3%). The region’s population is predominately Hispanic (83%), one of the poorest in the state with a per capita income of $31,965 compared to $50,355 for Texas, and has an unemployment rate nearly twice as high (5.3%) as Texas (3.5%).  The percentage of persons with a bachelor’s degree or higher in 2018 was decidedly lower in South Texas 17.8%) than the state (29.3%).  

Table 1 below shows the number of registered voters in Texas compared to South Texas.  The number of registered voters in South Texas represented less than 1 percent (0.6%) of the total number of registered voters in Texas. Due to its small number of registered voters, the South Texas region does not appear particularly influential in the 2020 presidential election.  

Table 1: Registered Voters by Regions, 2020

Geographic Area

Number

Percent

Texas

16,955,519

100.0

South Texas

103,833

0.6

Other Regions

16,851,686

99.4


Table 2 below shows that 11,071,502 million Texans voted during the 2020 election – a voter turnout of 65.3 percent. Of these total voters, 52.9 percent supported Donald Trump while 47.1 percent supported Joe Biden.  Compared to the state, support for Trump was slightly higher (54.4%) in South Texas..

Table 2:  Texas Votes Cast for Presidential Candidates, by State

and South Texas Region, 2020

Geographic Area

Total

Trump

Biden

Texas

11,071,502

5,860,096

5,211,406

Percent

100.0

52.9

47.1

South Texas

53,807

29,1 70

24,537

Percent

100.0

54.4

45.6

  Source: https://results.texas-election.com/county

Although it will be some time before we know the final votes cast in the 2020 election by race-ethnicity, a preliminary picture of the voting outcomes in Texas, Florida and Arizona were provided by CNN exit polls on election day. [16] An election exit poll is a poll of randomly selected voters that is taken immediately after they have exited a polling station. Exit polls can be affected by non-response bias, language bias, and clustering sampling methods that have been criticized for excluding Spanish-speaking voters who often vote for Democratic candidates.[17]  Table 3 below summarizes the results for Texas that included 4,768 voters.  Statewide Latino support for Joe Biden was higher (58%) than South Texas (45.6%) while statewide Latino support was lower for Donald Trump (41%) than South Texas (54.4%). Table 4 shows that in Florida the margins for Latino support were closer but still higher for Joe Biden (52%) than Donald Trump (47%).  Table 5 shows that in Arizona, Latinos strongly supported Joe Biden (63%) over Donald Trump (36%).

Table 3: Exit Poll Outcomes for Texas Presidential Candidates, 2020

(Percent)

Candidate

Race-Ethnicity of Voter

White

Black

Latino

Asian

Donald Trump

66

9

41

30

Joe Biden

33

90

58

63

Source:  CNN Exit Polls, n = 4,768


Table 4: Exit Poll Outcomes for Florida Presidential Candidates, 2020

Candidate

Race-Ethnicity of Voter

White

Black

Latino

Asian

Donald Trump

61

9

47

n/a

Joe Biden

38

89

52

n/a

Source:  CNN Exit Polls, n = 5,906 ( n/a = sample to small to project)


Table 5: Exit Poll Outcomes for Arizona Presidential Candidates, 2020

Candidate

Race-Ethnicity of Voter

White

Black

Latino

Asian

Donald Trump

51

n/a

36

n/a

Joe Biden

47

n/a

63

n/a

Source:  CNN Exit Polls, n = 1,639 (n/a = sample too small to project)


To obtain a more detailed picture of candidate support at the county level for South Texas, Table 6 below presents the eight “heavily Hispanic” counties in South Texas that were included in the recent analysis by the Dallas Morning News [18] and used as the basis for sounding the alarm bell to Texas Democrats. Frio County was included in their analysis although it is part of West Texas.  The table reveals that support for Donald Trump ranged from 50 to 66 percent; the region produced a total of 8,975 college graduates who were 25 years or older; and there were high concentrations of Hispanics that ranged from 73 to 94 percent (median of 83%). The region showed only 103,833 registered voters.


Table 6: Heavily South Texas Hispanic Counties Carried by Trump

County

Total Registered Voters

No. Hispanic College Graduates 25yrs & Over

Percent Voted for Trump

Percent Voted for Biden

Pct. Hispanic Pop. 2018

Frio (West Tx)

8,984

500

53.7

46.3

78.8

Jim Wells

26,636

1,784

54.8

45.2

80.3

Kenedy

296

12

66.1

33.9

87.7

Kleberg

18,749

2,254

50.9

49.1

72.7

LaSalle

4,426

345

55.9

44.1

82.4

Reeves

7,558

431

61.7

38.3

75.1

Val Verde

28,927

3,021

55.0

45.0

81.8

Zapata

8,257

628

52.8

47.2

94.2

Total 8 Counties

103,833

8,975

54.4

45.6

83.0

           Source: https://results.texas-election.com/county / ACS 2018 5-Year Estimates. 

Previous polling of U.S. Latinos by the Pew Research Center revealed that Joe Biden’s support was distinctly higher for college graduates (69%) than non-college graduates (61%).[19]   The percentage of college graduates in the South Texas region was 17.8 percent, which was distinctly lower than the State of Texas (29.3%) and the U.S. (31.5%). [20] The South Texas region produces its share of college graduates, but many move away due to a poor economy, leaving only 8,975 graduates who resided in the region in 2018. The political potential of South Texas is limited by the small number of registered voters and college graduates.

In our opinion, the high percentage of Hispanics in the South Texas region (83.0%) is perhaps the key factor that attracts the attention of political candidates, journalists and pundits who tend to portray South Texas as the bell weather region for Texas Latino politics.  However, the focus on percentages can be misleading as an indicator of political influence when the population base and number of registered voters is small in comparison to other regions in Texas.   

Considerably greater political benefit was realized by the Biden campaign in larger urban areas in Texas with higher numbers of Hispanic registered voters and college graduates. Table 7 below page presents a similar profile for the top five Texas counties ranked by the total number of registered voters. It is readily apparent that these five counties included a much larger number of registered voters (7.1 million) and more Hispanic college graduates (449,751) despite having a more moderate concentration of the Hispanic population ranging from 29 to 60 percent (median = 41%). More importantly, support for Joe Biden was distinctly higher than the South Texas region, ranging from 50 to 73 percent. Interestingly, Travis County had one of the lowest percentages of the Hispanic population (33.9%), yet also revealed the highest level of support for Joe Biden (73.0%) – an affirmation of the political power leveraged by the college-educated community surrounding The University of Texas at Austin. Thus, a moderate concentration of Hispanics coupled with a substantial college-educated community appears to have substantially contributed to Joe Biden’s standing in Texas.

Table 7: Voter Profile of Top 5 Texas Counties Ranked by Number of Registered Voters

Top 5 Counties

Total Registered Voters

No. Hispanic College Graduates 25yrs & Over

Pct. of All Votes for Trump

Pct. of All Votes for Biden

Pct. Hispanic Pop. 2018

Harris

2,480,522

140,157

43.4

56.6

42.6

Dallas

1,398,469

54,553

33.9

66.1

39.9

Tarrant

1,212,524

68,466

50.0

50.0

28.5

Bexar

1,189,373

118,109

40.8

59.2

60.0

Travis

854,577

68,466

27.0

73.0

33.9

Total 5 Counties

7,135,465

449,751

40.2

59.8

41.0


The political muscle of communities with colleges and universities has been documented by other analysts as well. In past presidential elections, counties with flagship higher education institutions have increasingly swung toward Democrats.  According to a recent analysis of 2020 election results by The Chronicle of Higher Education, Trump carried 87 of the 136 counties in five states that flipped from Trump in 2016 to Biden in 2020 (Arizona, Georgia, Michigan, Pennsylvania and Wisconsin) that included four-year public or private nonprofit colleges with at least 100 students.  Biden carried only 49 of these counties according to unofficial results. How did Biden manage to flip these five states?  As explained by the reporter analyzing this outcome:

“But Biden’s counties were more populous:  They produced 12.7 million total votes, more than double the 5.4 million votes that came from the counties with colleges in them that Trump won.  Biden’s counties, while smaller in number, also had more colleges in them:  191 to 138 in Trump’s counties.”  (page 2) [21]


Thus, Trump’s advantage of capturing more counties was overcome by Biden’s advantage of capturing fewer counties with substantially more voters.


Did Weak Support in South Texas Cause Joe Biden to Lose Texas?

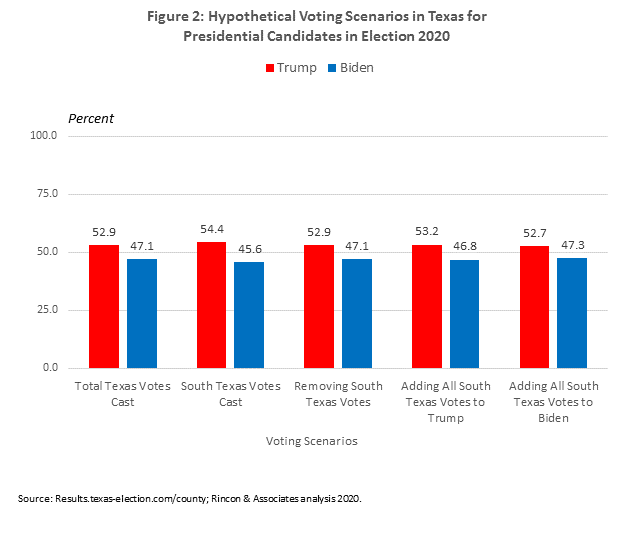
Some of the news stories suggested that Joe Biden had lost the Texas vote to Trump due to weak Latino support in South Texas compared to the support previously enjoyed by Hillary Clinton in 2016.  To address this issue, we conducted three hypothetical analyses to evaluate how the statewide voting outcomes for Donald Trump and Joe Biden would change under the following three scenarios:

·       Scenario 1: All of the votes cast by South Texas were removed from the total votes cast in Texas

·       Scenario 2: All of the South Texas votes were cast in favor of Donald Trump

·       Scenario 3: All of the South Texas votes were cast in favor of Joe Biden

Table 8 below presents the calculations used to evaluate these three scenarios.

Table 8: Hypothetical Voting Scenarios for Presidential Vote in Texas

Scenario

Trump

Biden

Total

Total Texas Votes Cast

5,860,096

5,211,406

11,071,502

Percent

52.9

47.1

100.0

South Texas Votes Cast

29,270

24,537

53,807

Percent

54.4

45.6

100.0

Scenario 1: Removing South Texas Votes

5,830,826

5,186,869

11,017,695

Adjusted Percent

52.9

47.1

100.0

Scenario 2: Adding All South Texas Votes to Trump

5,884,633

5,186,869

11,071,502

Adjusted Percent

53.2

46.8

100.0

Scenario 3: Adding All South Texas Votes to Biden

5,870,826

5,240,676

11,071,502

Adjusted Percent

52.7

47.3

100.0

Source: Results.texas-election.com/county; Rincon & Associates Analysis, 2020

Using the percentages for each scenario in Table 8, Figure 2 below clearly illustrates that under each scenario, Donald Trump still wins the Texas vote.  Thus, the votes from South Texas – regardless of whether they were totally removed or changed to votes for Trump or Biden – would not have changed the final Texas vote outcome for the presidential candidates.

How much confidence can we place on Hispanic polling results?

As final food for thought, it is helpful to weigh in the insights from The New York Times polling expert – Nate Cohn – who recently shared his post-mortem of the 2020 election in an op-ed entitled “What went wrong with polling?  Some early theories.”  Of particular relevance are his conclusions about the extent to which 2020 polling errors were influenced by Hispanic voters. The following comments are paraphrased from his narrative:

“What appeared in Miami-Dade was not just about Cuban-Americans.  Although Democrats flipped a Senate seat and are leading the presidential race in Arizona, Mr. Trump made huge gains in many Hispanic communities across the country…Many national surveys don’t release results for Hispanic voters because any given survey usually has only a small sample of this group….But if the Florida polls are any indication, it’s at least possible that national surveys missed Mr. Trump’s strength among Hispanic voters.  It seems entirely possible that the polls could have missed by 10 points among the group. If true, it would account for a modest but significant part – maybe one-fourth – of the national polling error.”  (p. 6) [22]


Mr. Cohn’s assessment may have merit regarding pollsters who only occasionally conduct polls of U.S. Hispanics and thus more likely to include common sources of bias in studies of this population segment. However, the results of polls of U.S. Hispanics conducted by more experienced pollsters of Hispanics – such as Latino Decisions and Pew Research Center — often include larger samples and were more closely aligned with the results of exit polls conducted by CNN — resulting perhaps in less polling error.  In our recent publication, “The Culture of Research,” [23]  we discuss the following common sources of bias that are observed in surveys of multicultural populations:


·       Identity Bias:  The use of vague, outdated or offensive race-ethnic labels that lead to over-counts or under-counts of respondents, or just missing data.

·       Coverage Bias: The use of sampling frames that exclude Hispanics, immigrants, the lower income and non-English speakers.

·       Sampling Bias:  Selecting samples of respondents that do not represent the population of interest, often by using non-random samples, small samples or sampling high density areas populated by Blacks, Hispanics or Asians. 

·       Mode Bias: Providing survey respondents only one mode (i.e., telephone, online or mail) to complete a survey which can exclude persons with vision, hearing or speaking impairments, lower literacy skills, or no Internet access.

·       Language Bias: Providing English-only surveys or poorly translated surveys to Hispanic and Asian immigrants lowers response rates and response quality since immigrants prefer native language surveys that are accurately translated.

·       Weighting Bias: Distorted statistical indicators can result from the failure to apply weights to correct survey sample imbalances or using weights that are outdated.


We agree with Mr. Cohen that greater polling error can occur in studies that include Hispanic populations, although we would add that such errors are more likely to occur in polls conducted by companies that do not have a strong track record for conducting studies of U.S. Hispanics.


Conclusion

Although the final 2020 election results with detailed demographic information will not be available for several months, there are some general conclusions that we can make given the information reviewed thus far:


·       Joe Biden did not lose Texas due to weak support from South Texas Latinos but rather the limited political resources in the region.

·       Latino voters were highly engaged to vote in the 2020 election as determined by pre-election polls.[24]

·       Despite the threat of COVID-19 and numerous voter suppression tactics by the Republican Party, Latinos turned out to vote in historic numbers.

·       Latinos were responsive to the message strategies of both campaigns, whether the message was accurate or fabricated. Latino Trumpers in Florida and Texas appeared more trusting and easier to mislead with false information.

·       Latinos revealed stronger support for Joe Biden than Donald Trump in Texas, Florida and Arizona, although stronger than expected Latino support was observed for Donald Trump.

·       Joe Biden revealed stronger support among Hispanic women, the college-educated, and those living in large urban areas.  Donald Trump showed stronger support from Hispanic males who were not college educated and lived in smaller urban and rural communities.

·       There is reason to believe that national pollsters experienced more errors when measuring the sentiments of Hispanic voters, although more confidence was proposed for pollsters with a stronger track record in polling the Hispanic population and using higher standards.


End Notes


[1] CNN Exit Polls (2020, November 11). Accessed at: https://www.cnn.com/election/2020/exit-polls/president/national-results/0

[3] Garrett, R.T. and Hacker, H.K. (2020, November 4). Dark alley no more:  This time, Texas Republicans were ready for the Democrats. Dallas Morning News. Accessed at  https://www.dallasnews.com/news/elections/2020/11/04/dark-alley-no-more-this-time-texas-republicans-were-ready-for-the-democrats/

[4] Ibid.

[5]  Medina, J.  (2020, October 19). The macho appeal of Donald Trump. New York Times. Accessed at https://www.nytimes.com/2020/10/14/us/politics/trump-macho-appeal.html

[6] Chavez, N. (2020, November 9).  ‘There’s no such thing as the Latino vote.’ 2020 results reveal a complex electorate.  CNN, Accessed at: https://www.cnn.com/2020/11/09/politics/latino-voters-florida-texas-arizona/index.html

[7] Ibid, 2.  Solis, D., Corchado, A., Morris, A., and Cobler, P. (2020, November 6). With the Latino vote up for grabs, how did Trump make inroads in South Texas? 

[8] Comptroller.Texas.Gov. (2020, November 6). The South Texas Region 2020 Regional Report. Texas State Comptroller, Accessed at:   https://comptroller.texas.gov/economy/economic-data/regions/south.php

[10]  Jatlaoui, T.C. Eckhaus, L., and Mandel, M.G.  (2019, November 29). Abortion Surveillance – United States 2016. MMWR Surveill Summ 2018; 68 (No. SS-11: 1-41. Accessed at: https://www.cdc.gov/mmwr/volumes/68/ss/ss6811a1.htm

[11] Korzenny and Korzenny, (   ).  Hispanic marketing.

[12]  Hancı, F. (2019, July 22).  Hate crimes increase in the US since Trump’s election. Politics Today, Accessed at        https://politicstoday.org/hate-crimes-increase-in-the-us-since-trumps-election/

[13] Brooks, B. (2019, November 12).  Victims of anti-Latino hate crimes soar in U.S.: FBI report.   Reuters. Accessed at https://www.reuters.com/article/us-hatecrimes-report/victims-of-anti-latino-hate-crimes-soar-in-u-s-fbi-report-idUSKBN1XM2OQ

[14]  Anderson, K.B. (2013, April). Consumer Fraud in the United States, 2011 The Third FTC Survey, Federal Trade Commission, Accessed at:   https://www.ftc.gov/sites/default/files/documents/reports/consumer-fraud-united-states-2011-third-ftc-survey/130419fraudsurvey_0.pdf

[15] Ibid 8, The South Texas Region 2020 Regional Report.

[16] Ibid 1, CNN Exit polls in Texas.

[17] Barreto, M. (2016, November 10). Lies, damn lies and exit polls. Latino Decisions. Retrieved from http://www.latinodecisions.com/blog/2016/11/10/lies-damn-lies-and-exit-polls/

[18] Ibid 3, Dark alley no more:  This time, Texas Republicans were ready for the Democrats.

[19] Krogstad, J.M. and Lopez, M.H. (2020, October 16).  Latino voters have growing confidence on Biden key issues, while confidence in Trump remains low. Pew Research Center, Accessed at:   https://www.pewresearch.org/fact-tank/2020/10/16/latino-voters-have-growing-confidence-in-biden-on-key-issues-while-confidence-in-trump-remains-low/

[20] Ibid 8, The South Texas Region 2020 Regional Report.

[21] June, A.W. (2020, November 15).  How higher ed helped flip 5 states in the 2020 election. The Chronicle of Higher Education.  Accessed at https://www.chronicle.com/article/how-higher-ed-helped-flip-5-states-in-the-2020-election

[22] Cohn, N.  (2020, November 10).  What went wrong with polling?  Some early theories.  The New York Times – Upshot. Accessed at https://www.nytimes.com/2020/11/10/upshot/polls-what-went-wrong.html 

[23] Rincon, E.T.  (2020, August 20).  The Culture of Research.  The Writer’s Marq, Dallas, Texas.

Texas Hispanic Construction Worker Mortalities Are Alarming: Is Anyone Listening?

The news was alarming: Hispanic construction workers represent over half (56%) of the state’s COVID-19 deaths although Hispanics currently represent 40 percent of the state’s population.  The story, reported today by The Dallas Morning News,[1]discussed the results of a research study published in the Journal of the American Medical Association (JAMA) by a team of researchers at The University of Texas at Austin. The study pointed to the increased risk faced by Hispanic construction workers and living arrangements that preclude social distancing.

The story is also concerning for the issues that were not addressed. For example, the story did not include any comments from the one organization in North Texas that would have relevant insights to contribute to our understanding of this elevated health threat to Hispanic construction workers:  The Regional Hispanic Contractors Association.  

Previous COVID-19 news reports have focused considerable attention on essential workers in healthcare, the food industry and other occupations. However, the risks faced by construction workers have received relatively little attention, especially Hispanic workers who comprise 30 percent of all construction workers. Under the current administration, OSHA (Occupational Safety and Health Administration) has relaxed their inspections of occupations to verify compliance with COVID-19 safety measures which has undoubtedly contributed to the increased risk faced by Hispanic workers who often do not wear face masks.

Of course, we have known for several months that Hispanics and Blacks have been experiencing higher levels of COVID-19 illnesses and mortalities.  As I discussed in an earlier report,[2]  these COVID-19 mortality rates are likely much higher for Blacks and Hispanics since state and federal health data are often missing information on the race or ethnicity of COVID-19 mortalities. There is a simple procedure available that can estimate the race-ethnicity of a person based on their name and zip code with 80 to 90 percent accuracy – a tool that could be used to fill in the missing data and obtain a better estimate of COVID-19 mortalities.  

Communication of these alarming health risks to the right audiences is also problematic. For example, it is not likely that the Hispanic construction workers and families that need to know about their elevated risk of death related to COVID-19 will read the report in JAMA or The Dallas Morning News.  During the pandemic period, audiences are more likely to obtain news information from television and online sources if they have Internet access. And Hispanic construction workers are more likely to use Spanish-language sources of information.  Consequently, it is imperative that Spanish-language television stations like Univision and Telemundo assume an increased responsibility to ensure that COVID-19 health alerts are regularly communicated to their audiences.  Moreover, organizations like the Regional Hispanic Construction Association are perhaps the best vehicle to deliver and reinforce the health alerts to their membership.

While the issue of increased COVID-19 exposure and deaths of Hispanic construction workers is urgent, one wonders if the study findings will be sufficient to wake up the various stakeholders to take decisive action. As the story points out, Dallas-Fort Worth is second among the country’s largest building markets in September this year with an estimated 155,000 workers in the building sector.  But as one of the study authors, professor Lauren Meyers pointed out, the study findings do not necessarily mean that construction work needs to stop. “It means that we need to go to great lengths to ensure the health and safety of workers when they do go to work.” 

In the meantime, let’s ensure that Hispanic construction workers and their families are informed about the elevated risks that they face from COVID-19 and, more importantly, that they are provided practical solutions to mitigate the risks.  Following are a few suggestions for achieving these objectives: 

  • Being the second highest building market in the nation, it seems reasonable to ask investors and builders to create a fund that is dedicated to keeping the Hispanic contractors and workforce safe and able to meet basic expenses. 

  • Create a fund to offset the costs of funeral expenses for the many Hispanic families who have lost a family member working in the construction industry.
  • Pressure OSHA to conduct more frequent checks of construction work sites to ensure that workers are following COVID-19 safety guidelines and have a sufficient supply of PPE supplies.
  • Provide funding for temporary shelter, such as trailers or hotel rooms, to provide family members the opportunity to quarantine themselves when necessary from exposed construction workers. 
  • Ensure that all construction workers are tested for the COVID-19 virus before starting their work shift.
  • Provide continuing funding to organizations such as the Regional Hispanic Contractors Association so that they are able to conduct the needed training to Hispanic contractors regarding COVID-19 safety measures and risks.
  • Lastly, ensure that all COVID-19 related communications are delivered in both English and Spanish languages.  Native-born Hispanics primarily view English-language media while foreign-born Hispanics primarily view Spanish-language media – a fact that we have confirmed from our 45 years of evaluating the media habits of Hispanics throughout the U.S.

End Notes


[1] Difurio, D. (2020, October 31).  Construction workers hit hard by virus. Dallas Morning News. Accessed at https://edition.pagesuite.com/infinity/article_popover_share.aspx?guid=6e7208df-d7f4-44e9-af63-fef33cd734fb

[2]  Rincón, E.T. (2020, April 16).  Missing race-ethnicity data complicates Covid-19 mortality counts, But the solution is simple.  https://www.rinconassoc.com/missing-race-ethnicity-data-complicates-covid-19-mortality-counts-but-the-solution-is-simple