Our Survey Industry Is In Need of a Facelift
Declining response rates, missing and ambiguous data, biased samples – these are just a few of the challenges faced by survey professionals that undermine the quality and usefulness of the many surveys that are used to make decisions about our quality of life. Complicating the work of survey professionals are the many transformations that are taking place in our nation, including the growth of the non-English speaking population, displacement of landlines with cell phones, government regulations that limit the use of telephone surveys, and call blocking technology that makes it easier for consumers to reject unwanted telephone calls.
Many of the challenges faced by survey practitioners, however, are a direct consequence of long-standing survey industry practices that unnecessarily compromise the quality and representativeness of survey data. For example:
- English-only Surveys: Respondents are usually provided only one language option to complete a survey – usually English – which excludes people who cannot read, write or speak English very well from participating in a survey. Our experience shows that 2 in 3 U.S. Latino adults prefer a Spanish-language interview, while nearly 8 in 10 U.S. Asian adults prefer a native-language interview. When language options other than English are not provided to respondents, response rates decline, and data quality suffers because comprehension of the questions being asked is less than ideal.
- Single-Mode Surveys: Only one mode of data collection is usually offered to survey respondents – either telephone, mail or online — which prevents many people from completing a survey because they lack reading or writing skills, have hearing or visual impairments, lack access to the Internet or get anxious when using it, or simply do not have a telephone. Indeed, offering a survey respondent only one mode to share their opinions can be counter-productive.
- Biased Sampling Frames or Lists: All sampling frames have recognized limitations that are often overlooked by survey practitioners. From a scientific point of view, the ideal sampling frame is a complete listing of persons or households that is inclusive of all members of the target community. Traditional sampling frames, however, fall far short of this ideal. For example, lists of landline telephone households tend to over-represent older residents and homeowners; online panels tend to over-represent whites, the more educated, younger and higher income residents, but tend to exclude immigrants, the lower income, Latinos, Asians and African Americans. Online panels may be cost effective and useful for national polling; however, online panels are not ideal sampling frames when conducting local studies of multicultural populations.
In the long run, these practices tend to make traditional surveys less accurate and representative of communities, leading to incorrect decisions regarding programs and policies that impact our quality of life. It is especially troubling that the opinions of certain segments of society are excluded because our survey industry has been slow to change its practices and adapt to the many transformations that are taking place in our nation.
There is a Better Alternative
SERENITY® is a unique multi-modal, multilingual survey response system that was designed by Dr. Edward T. Rincon. Dr. Rincon developed this patent-pending system based on his past 36 years of survey research experience in diverse communities as a solution to the recognized limitations of traditional survey practices. SERENITY® is effective in guiding a survey project through the critical steps of initial diagnostics, research design, implementation, and outcomes – assuring improved data quality and demographic representation by providing such features as:
- A detailed sampling plan developed by a qualified sampling statistician that ensures the proper representation of the target community;
- A recommendation for the right mix of incentives to encourage survey participation among diverse groups;
- Expanded choices to survey respondents in terms of data collection, such as multiple language options and multiple mode choices (i.e., mail, online, telephone) to survey respondents;
- Expert questionnaire design that removes labels or phrases that create confusion or discomfort among survey respondents; and
- Analytic reports that translate survey findings to actionable decision-making for programs and policies.
SERENITY® has been shown to be an excellent solution in past studies that involved high-stakes decisions, such as a study of U.S. multicultural consumers for a global automotive manufacturer, a state-wide study of energy efficiency among homeowners, a state-wide court-ordered study evaluating the communicative needs of Medicaid participants, and a marketing study for one of the largest urban hospitals in the U.S. These clients have experienced improvements in sales, survey response rates, data quality, and inclusion of groups that are typically under-represented using traditional survey practices.
To learn more about SERENITY,® we invite you to click on the following link to view an 8-minute presentation about this system. http://youtu.be/83H6PPgXLBI
To discuss how SERENITY® can improve the quality of your next survey research project, contact Dr. Edward T. Rincon at 214-750-3800.
Populus USA®
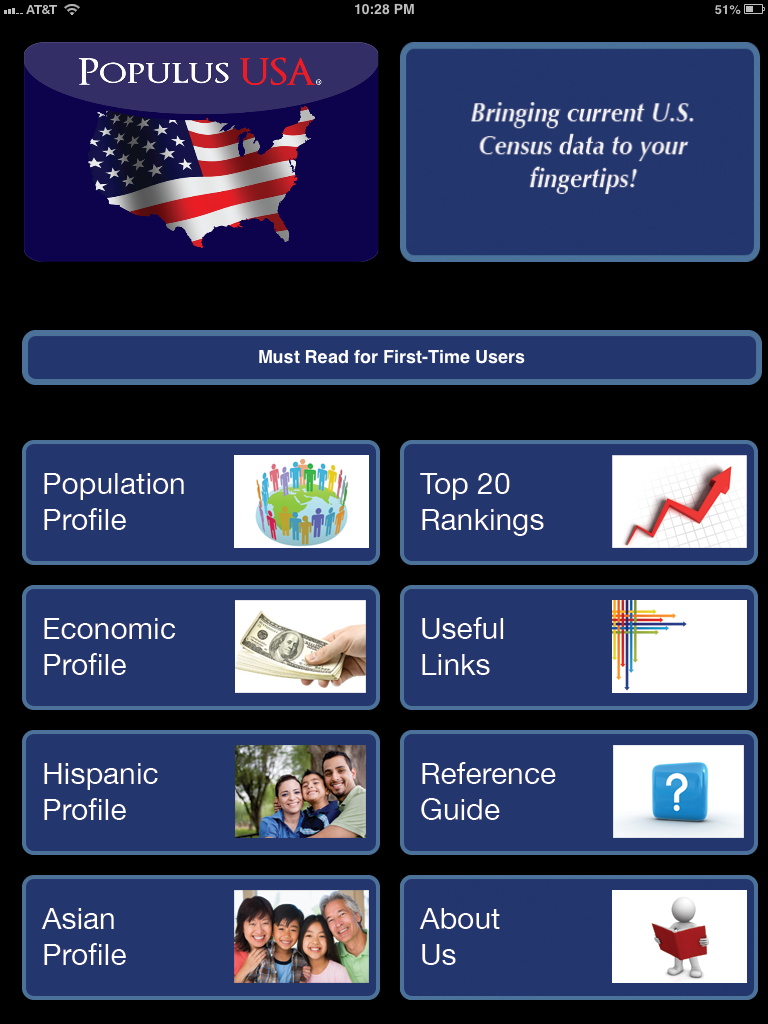
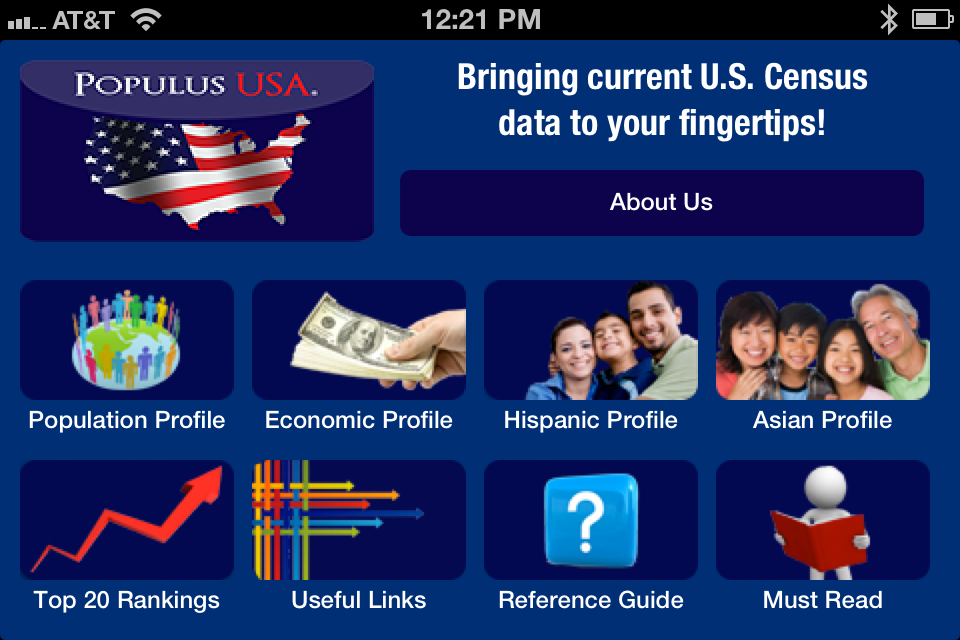
Populus USA® was designed for users that need instant access to current, basic demographic information about key race-ethnic groups in communities throughout the United States. The app was not designed as a substitute for the Census or ACS web site, but rather as a convenient tool when access to the Census or ACS web site is prevented by time, lack of an online connection, or insufficient knowledge to navigate these web sites. To keep the application useful yet easy to use, the following decisions were made regarding its design and scope:
- Sources of Information: All of the information is extracted from two of the most current sources of demographic information of U.S. residents: The 2010 Decennial Census and the 2011 American Community Survey. The 2010 Decennial Census provides the most complete enumeration of the U.S. population from a geographic point of view, while the 2011 American Community Survey is updated annually by the Census Bureau with a sample of households using a more limited number of geographic areas.
- Geographic Scope: The geographic scope used by each of these two sources varies considerably. The 2011 American Community Survey includes the U.S., all 52 states, 529 metropolitan/micropolitan areas, 822 counties, and 537 places or cities. For the Decennial Census 2010, the geographic scope is much broader and includes 52 states and Puerto Rico; 955 metropolitan/micropolitan areas; 3,221 counties; and 29,514 places or cities.
- Race/Ethnic Groups Included: Due to space and efficiency concerns, only four major race/ethnic groups are included in the tables, which are defined differently for each source. For the 2010 Decennial Census population profile tables, the data is presented for Total, NH White, NH Black, NH Asian, and Hispanic groups (“NH” means Non-Hispanic). For the ACS 2011, the data is presented for Total, White, Black, Asian and Hispanic groups. These two race/ethnic group formats were adopted for two reasons. First, not all of the Census and ACS table are tabulated by one or the other format on a consistent basis. Secondly, many analysts want to know the number of Whites, Blacks and Asians who are non-Hispanic.
Populus USA® is available for purchase at the Apple Store. Click here for further product information.
Populus USA® is not a product of or affiliated with Populous Holdings, Inc.


