

Many marketing decisions can be addressed by analyzing secondary sources of information, especially when time and budgets do not permit an immediate investment in primary research. Although there are an abundance of secondary sources available, not all of these sources are credible, objective or relevant. Our preference is to utilize original sources and avoid those that appear self-serving. By closely examining the methodology used to produce secondary data, we have identified a selected list of organizations that can be relied on to produce objective information, including the following:
- U.S. Census Bureau
- Bureau of Labor Statistics
- Department of Commerce
- State Data Centers
- Selig Center for Economic Growth
- Pew Hispanic Center
- U.S. Department of Education
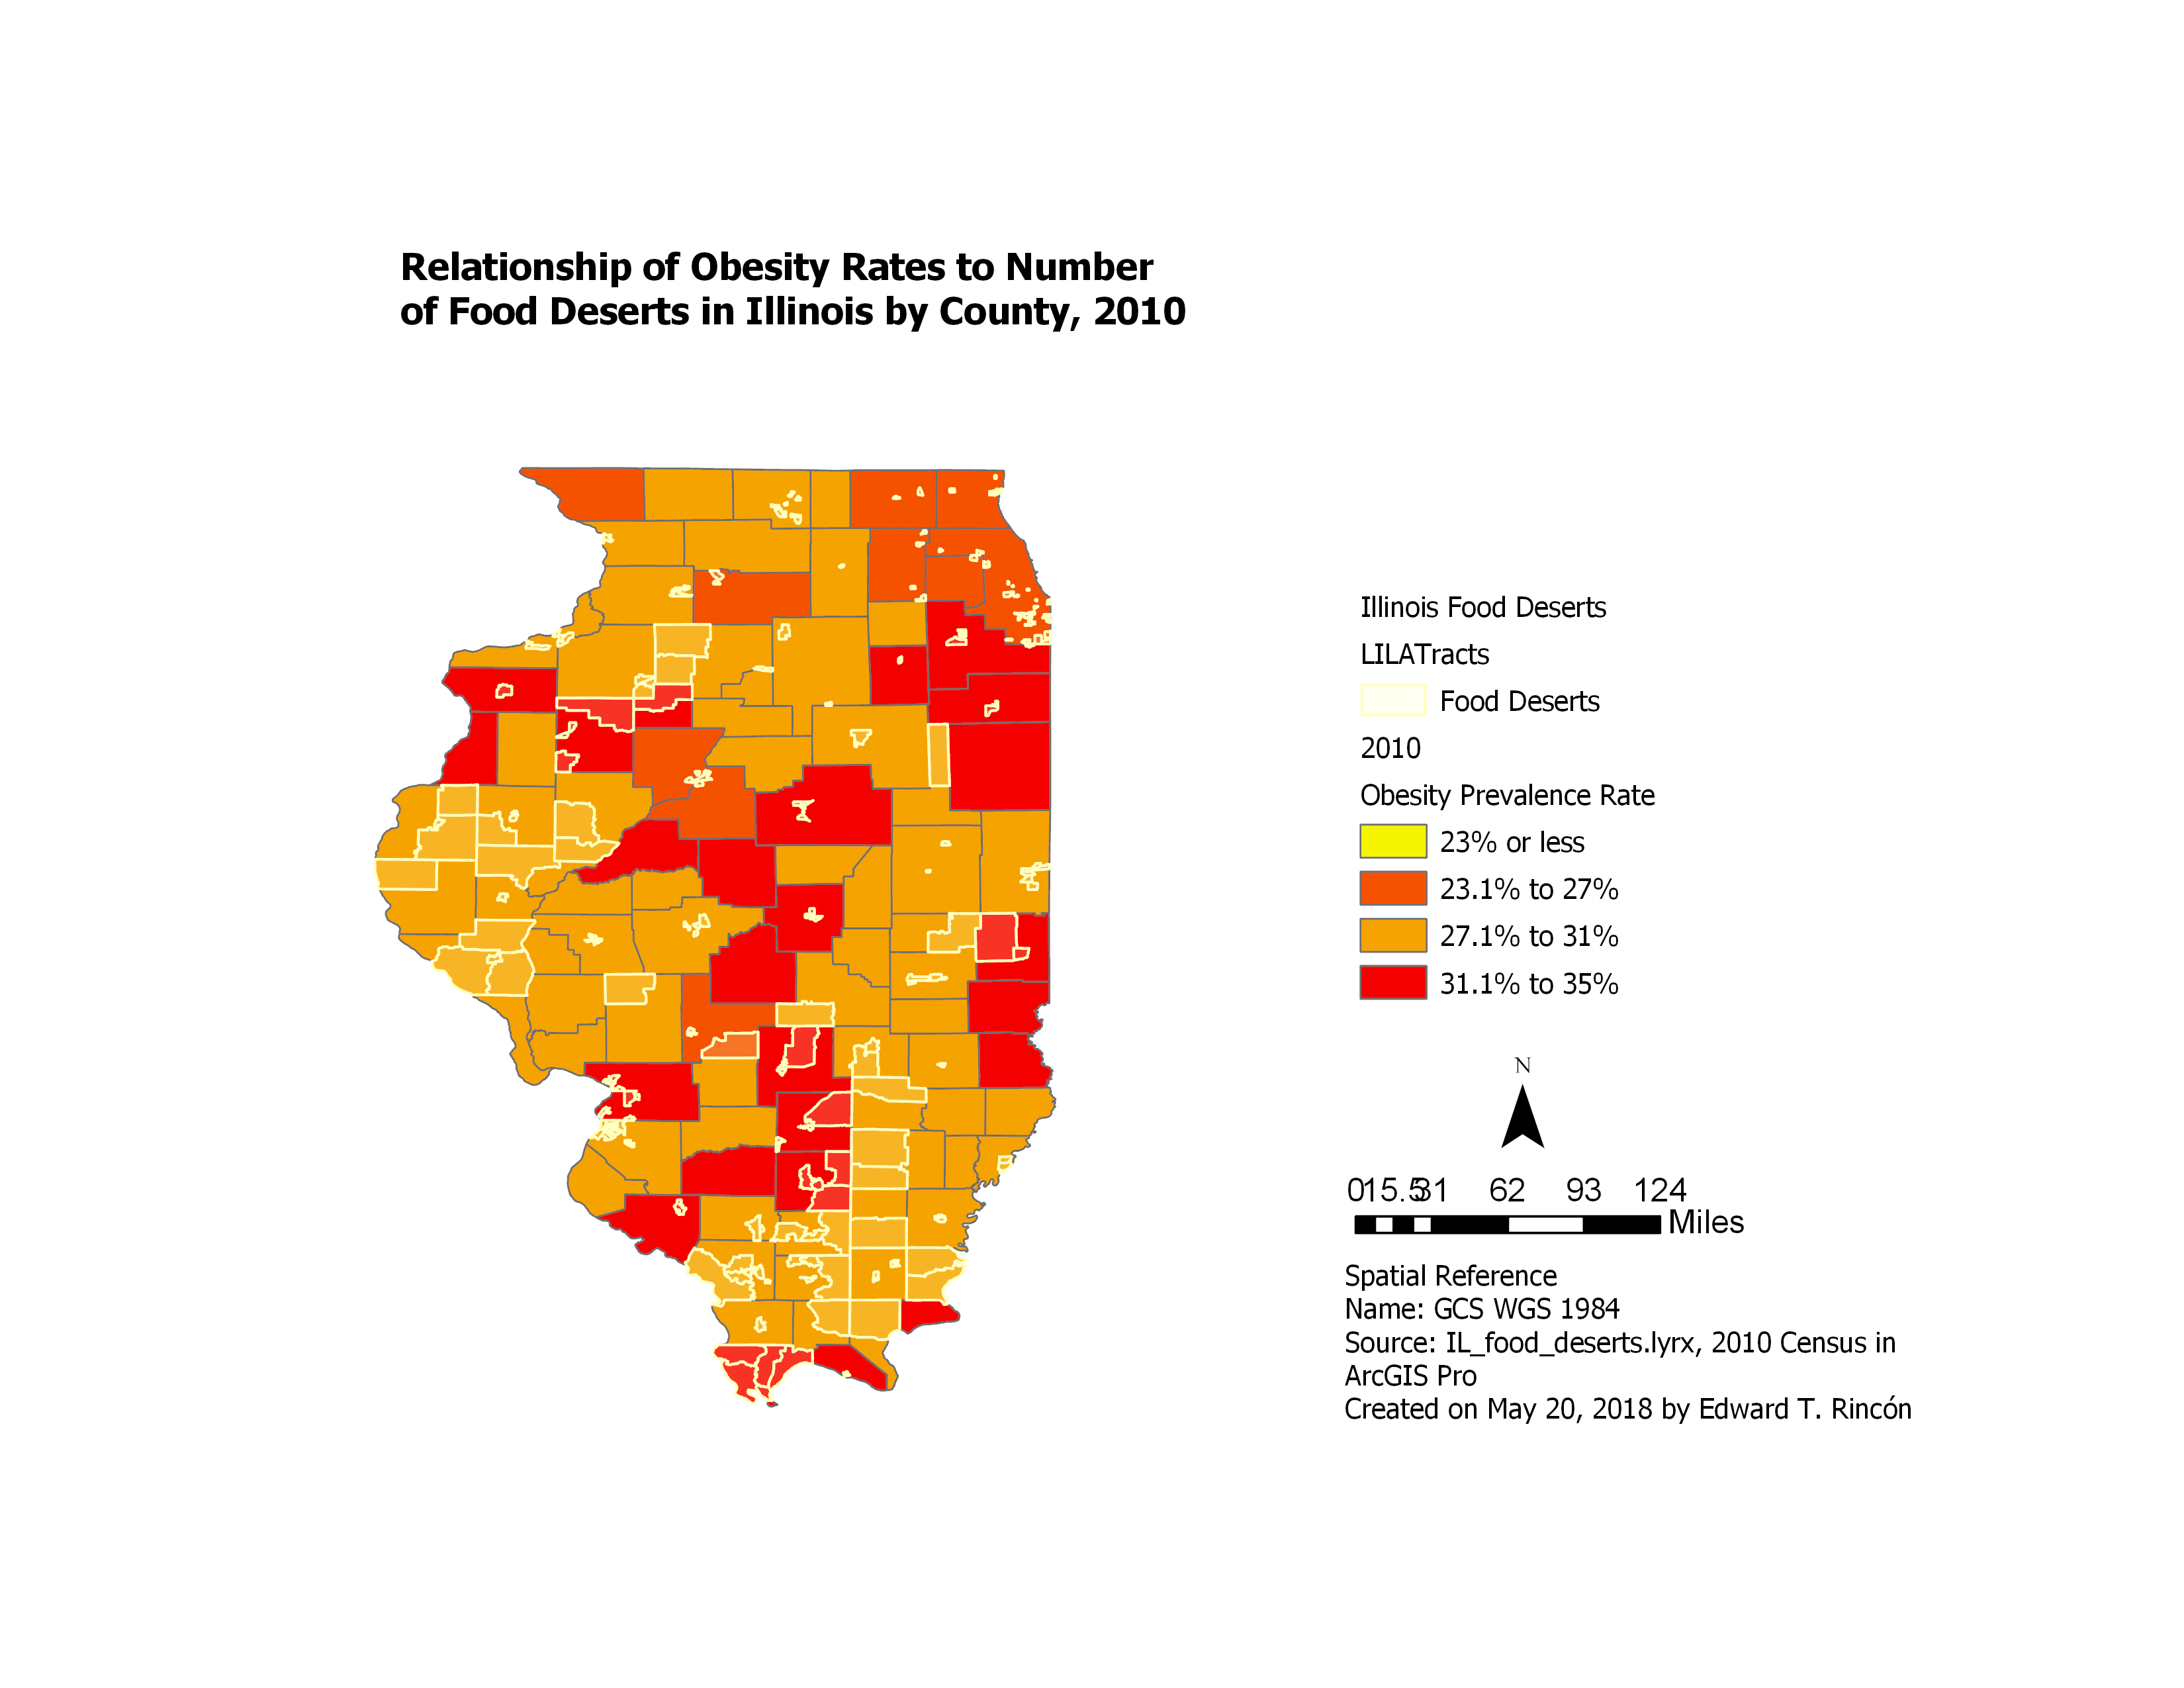
- U.S. Department of Agriculture
- Federal Bureau of Investigation Uniform Crime Reports
- Environmental Protection Agency
- Housing and Urban Development
- Center for Disease Control
Following are examples of how spatial analysis can be used to enhance our understanding about the quality of life and environments where U.S. residents reside.
Healthcare
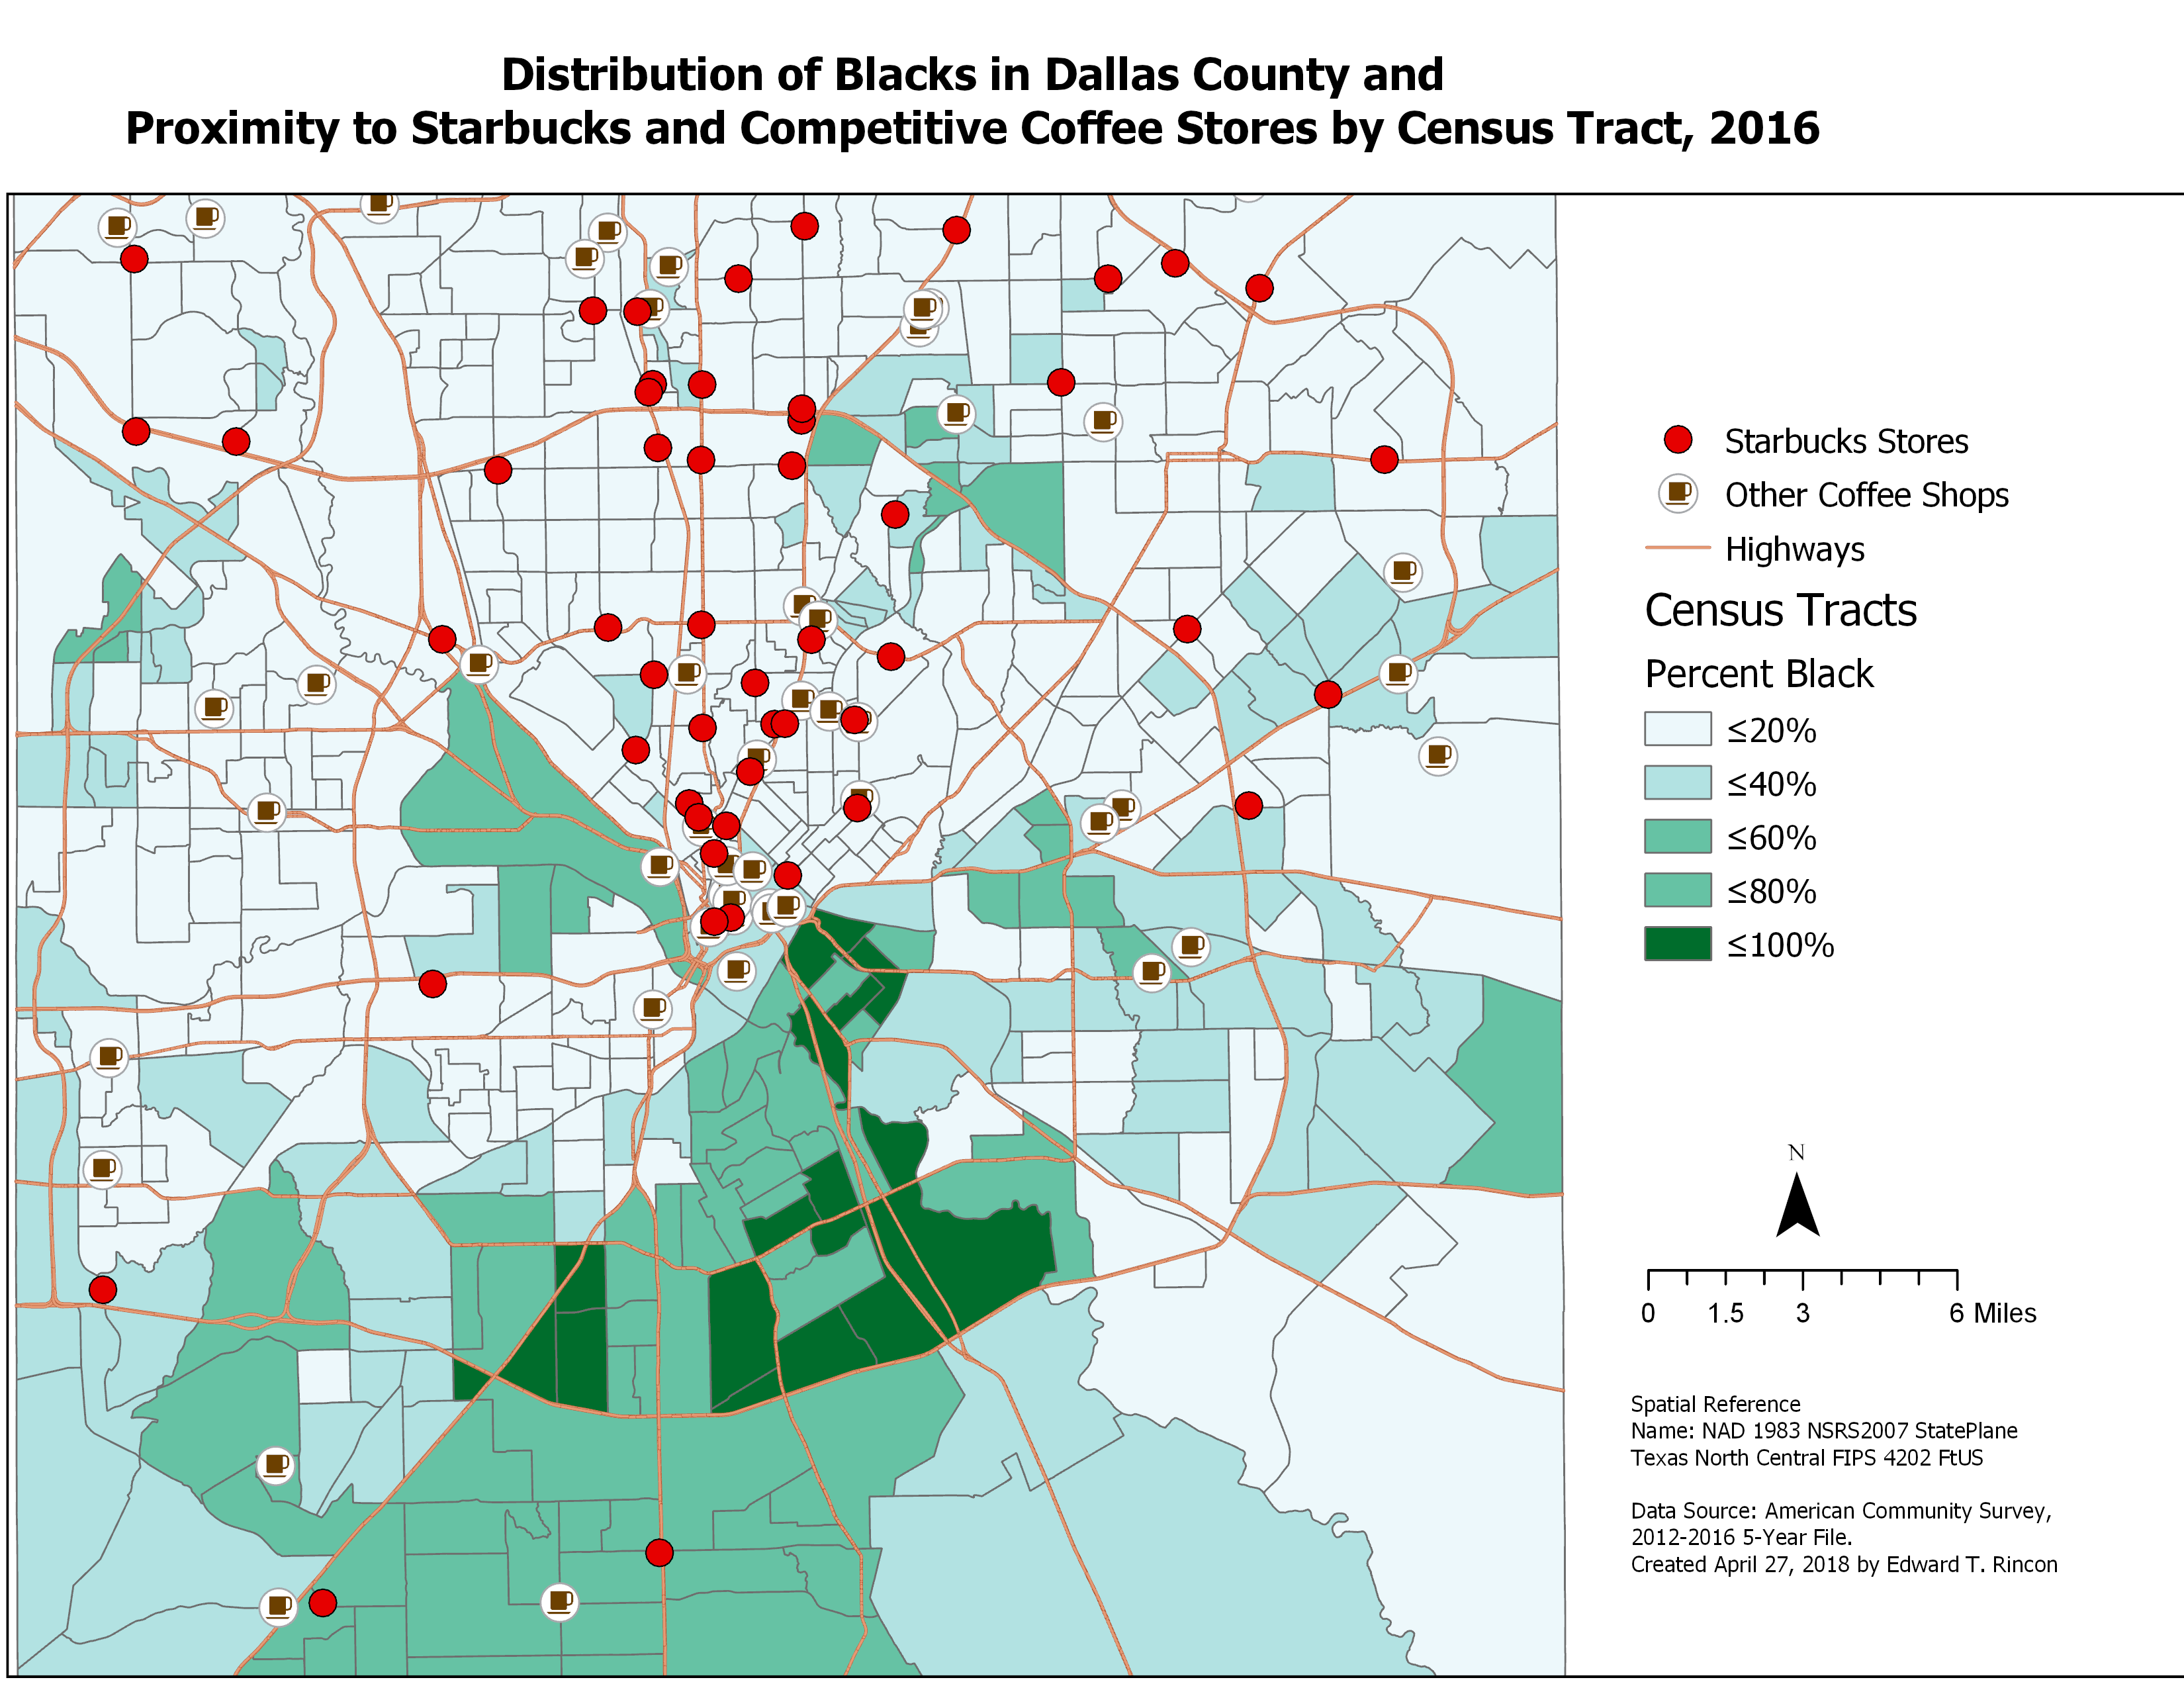
Retail Location Analysis
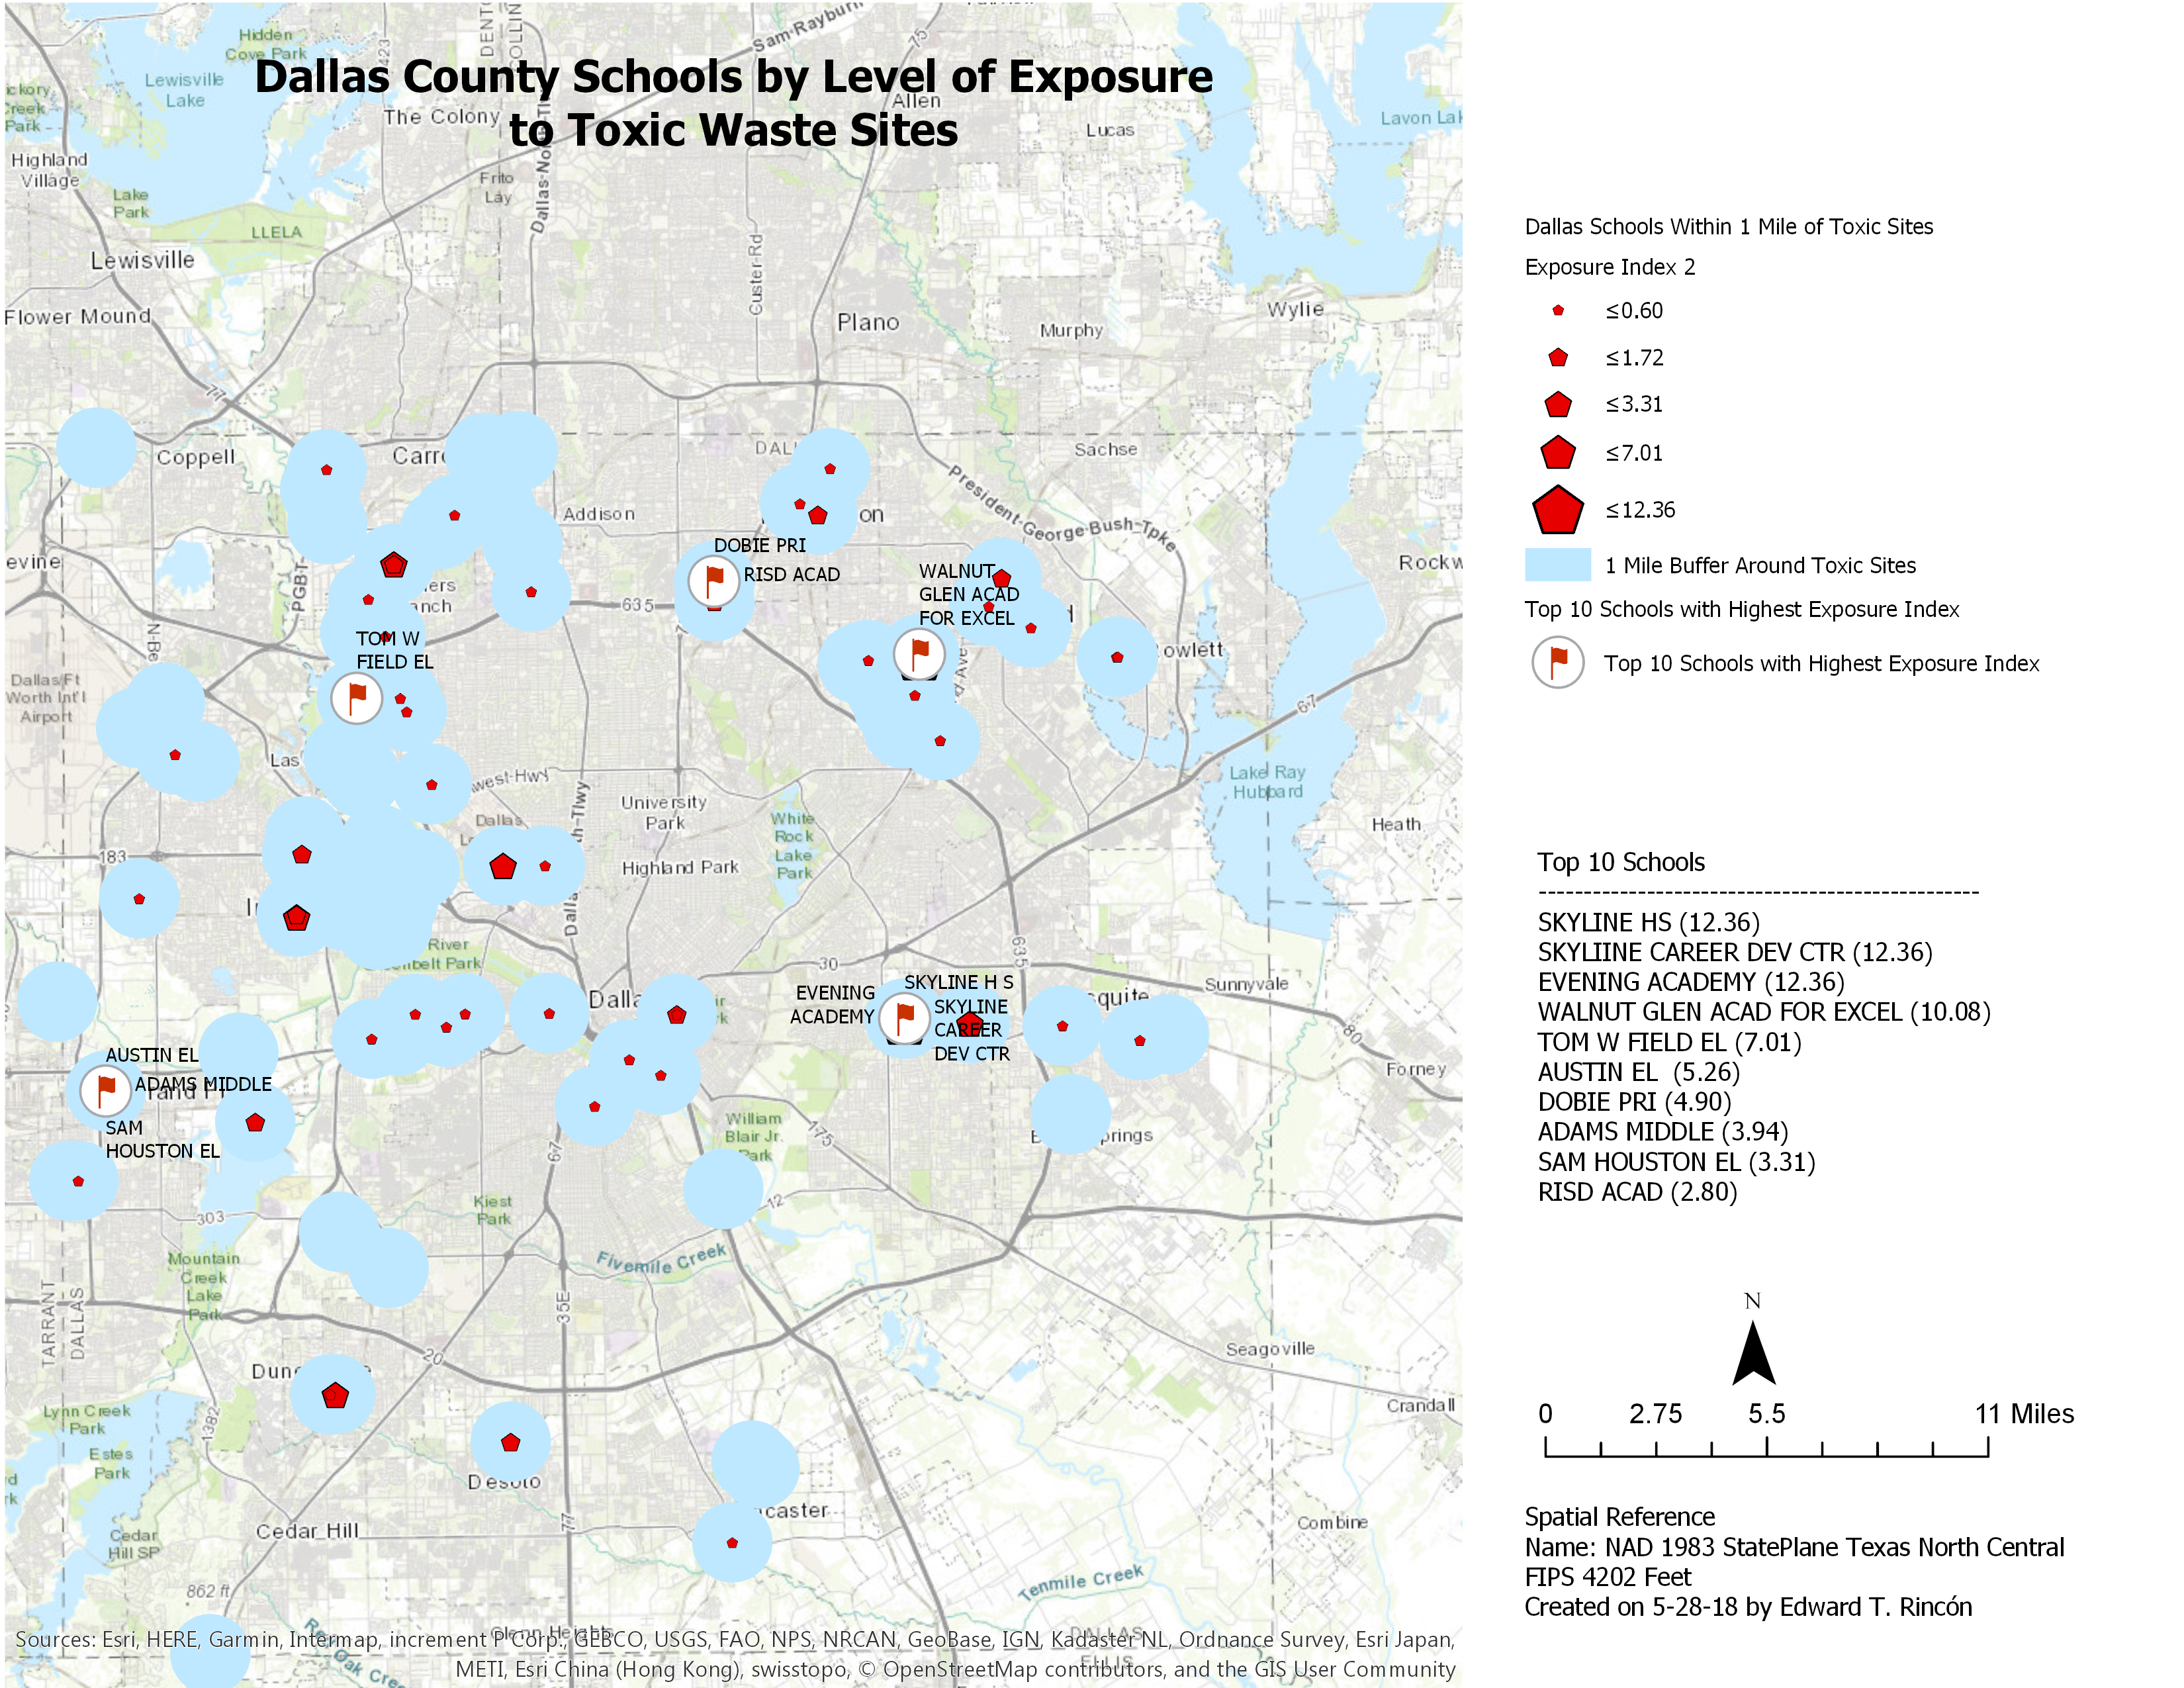
Environmental Hazards
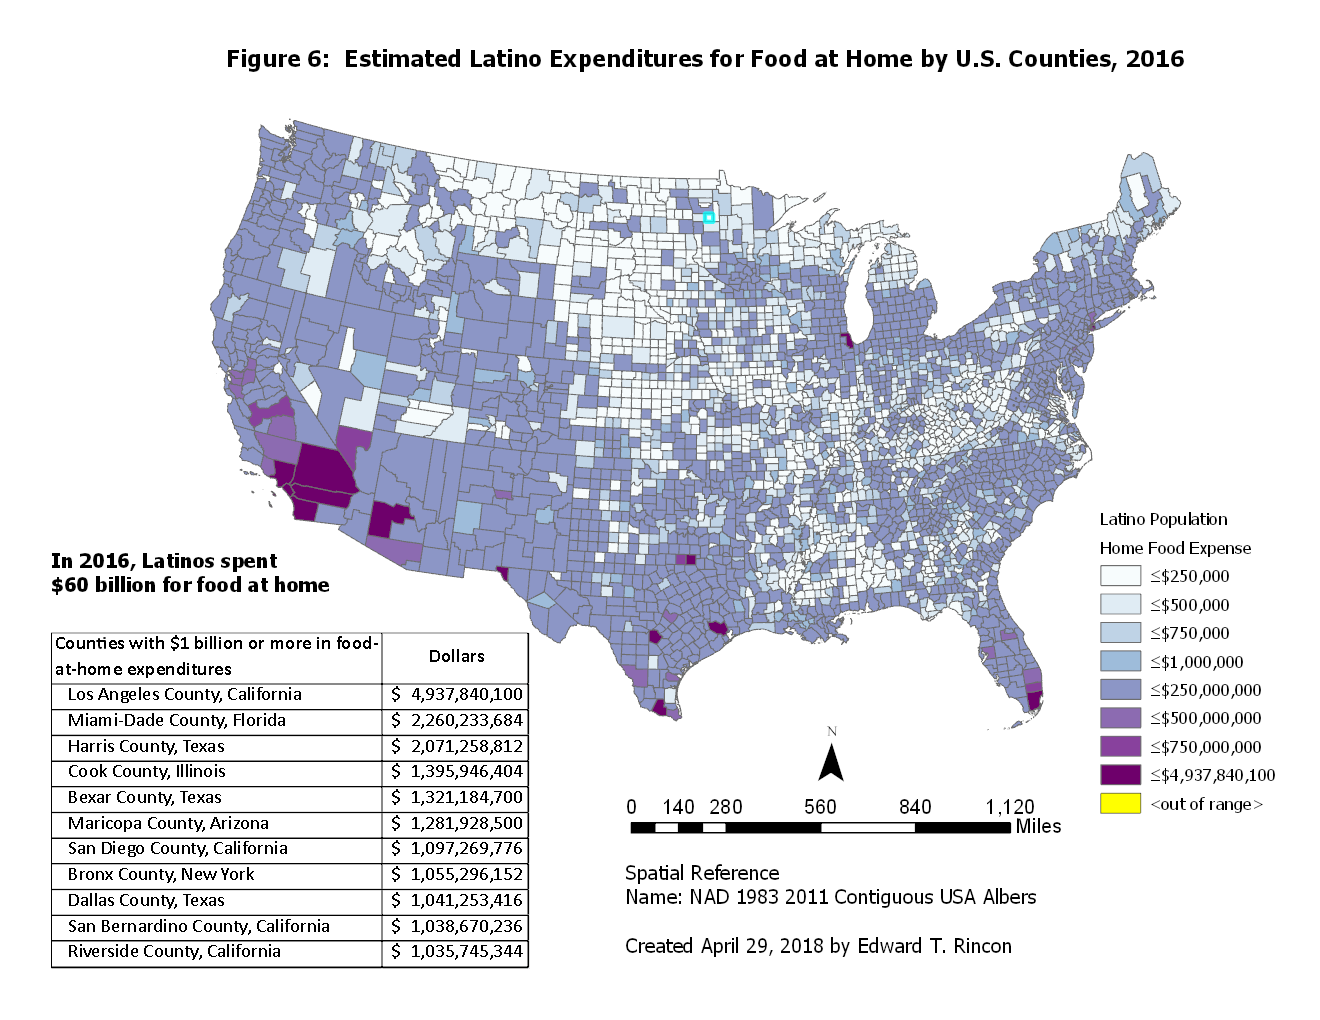
Food Expenditures
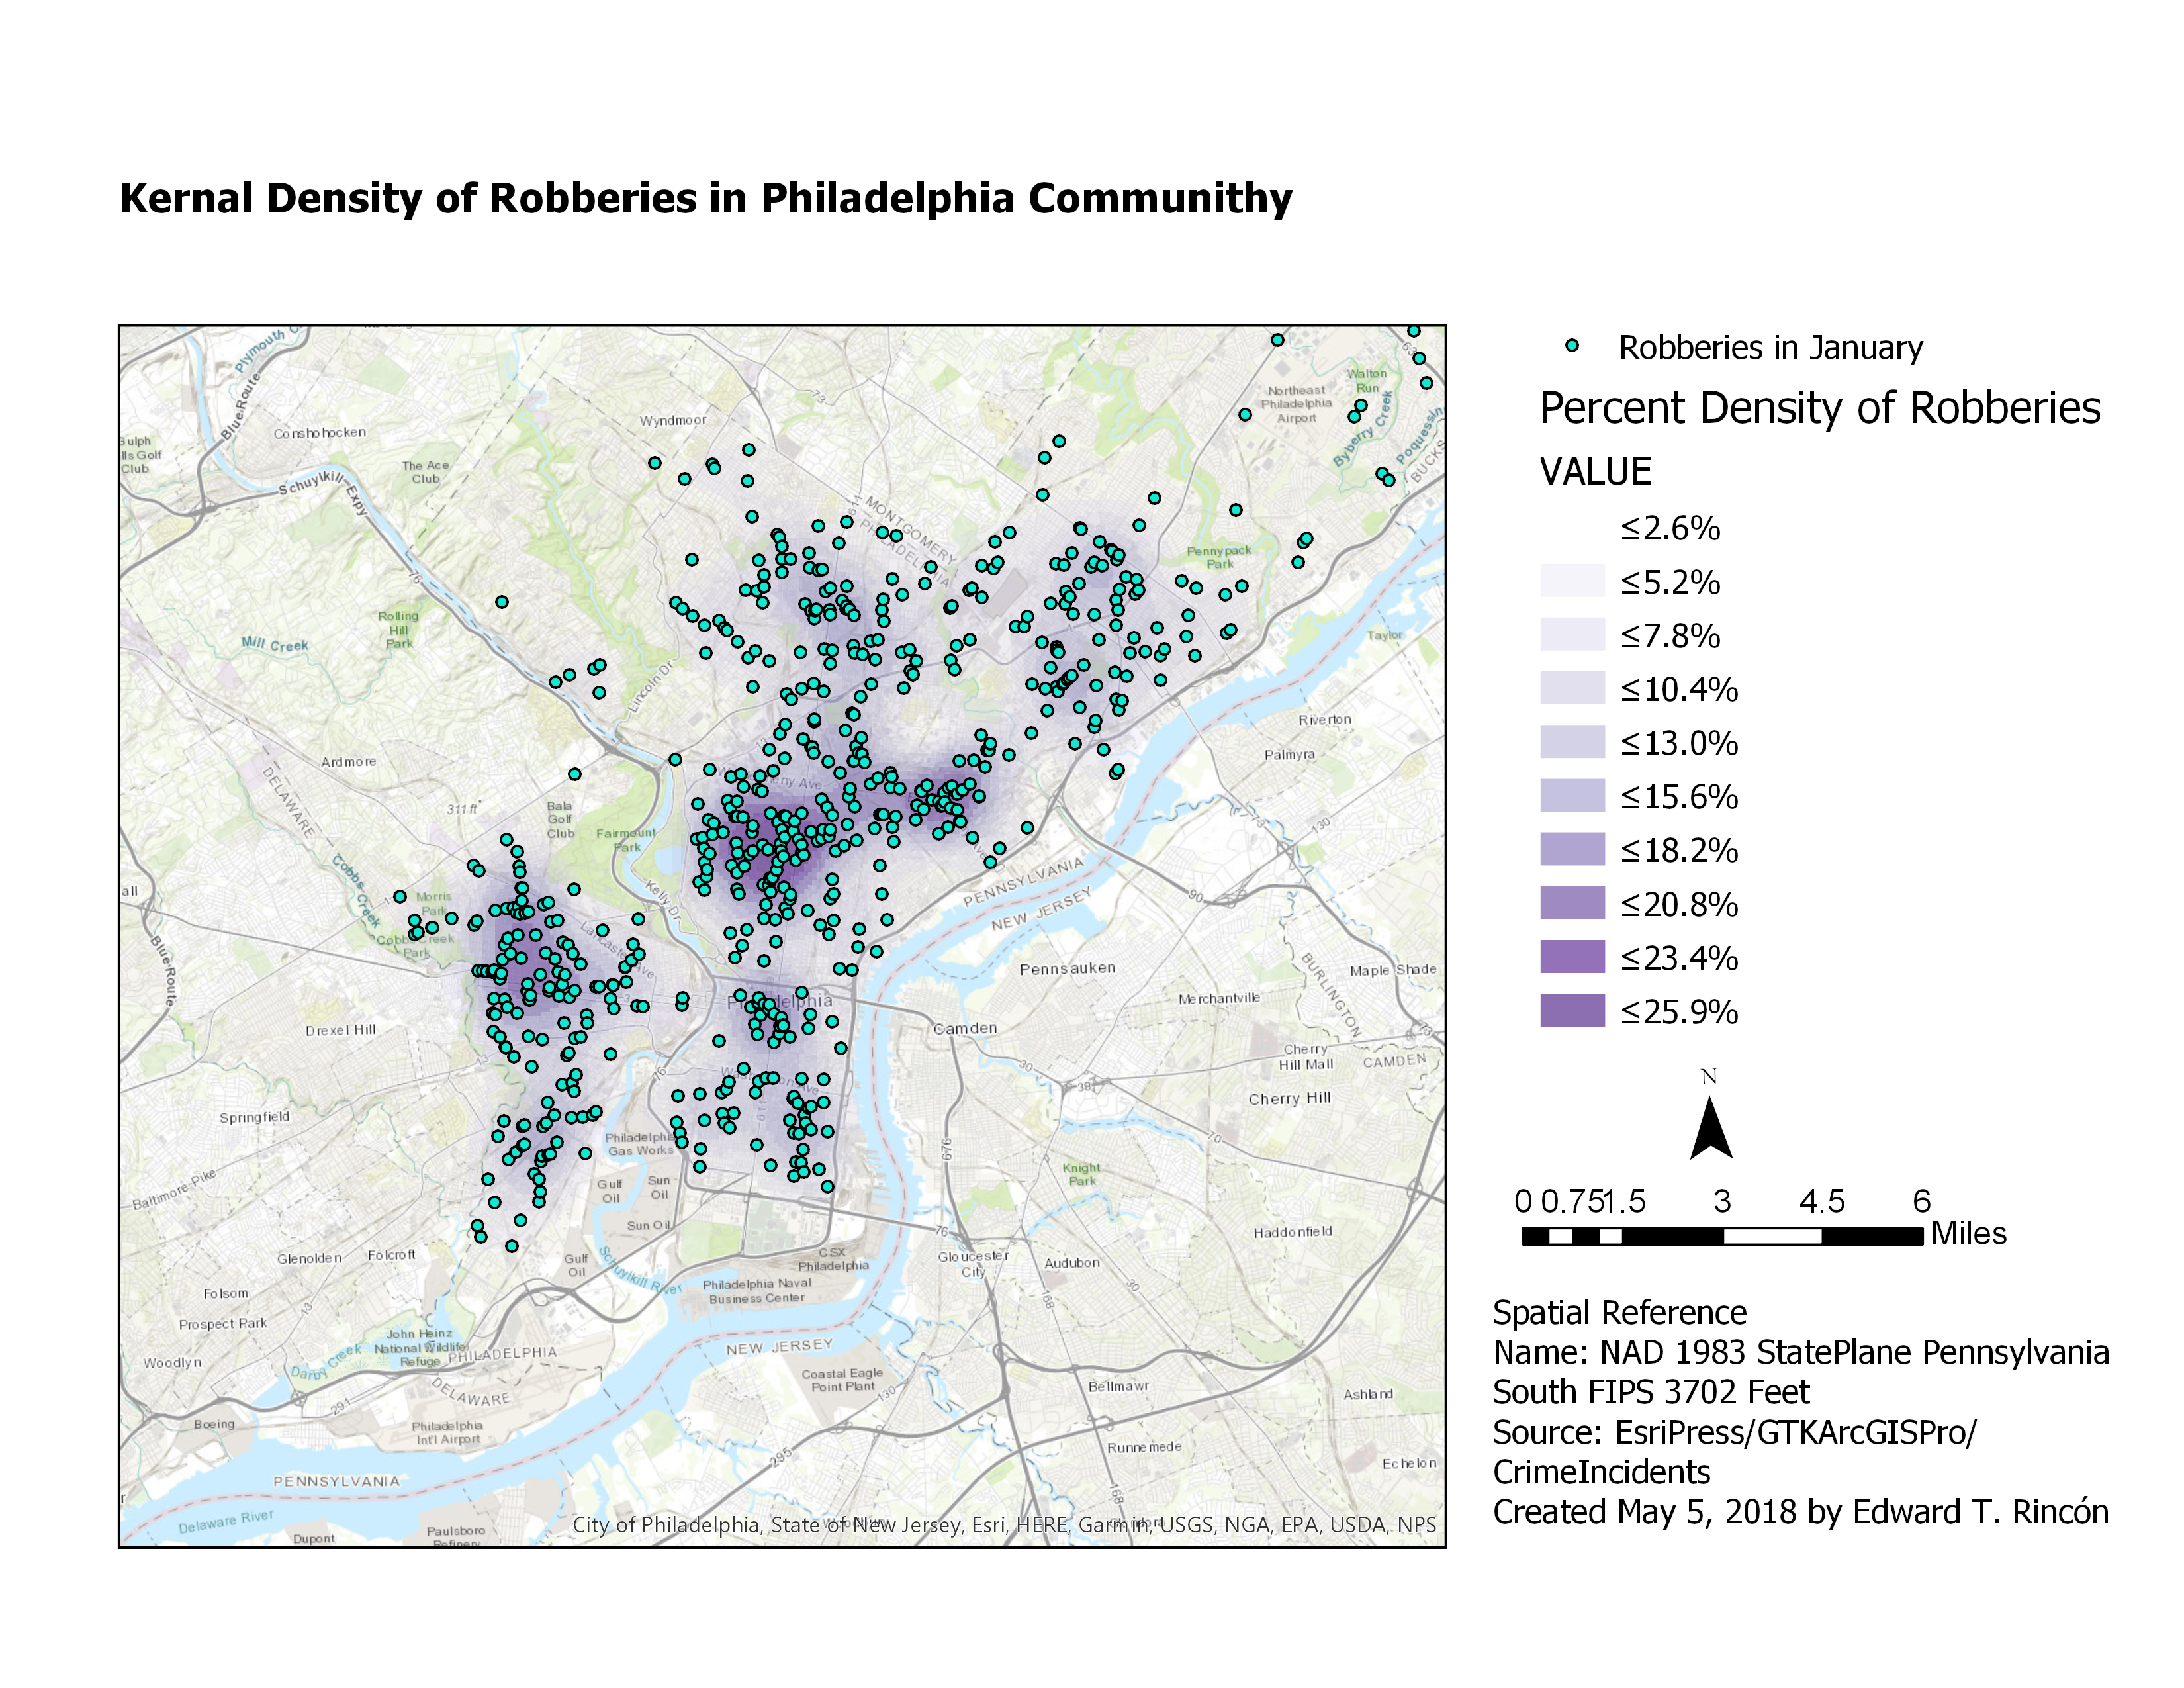
Crime
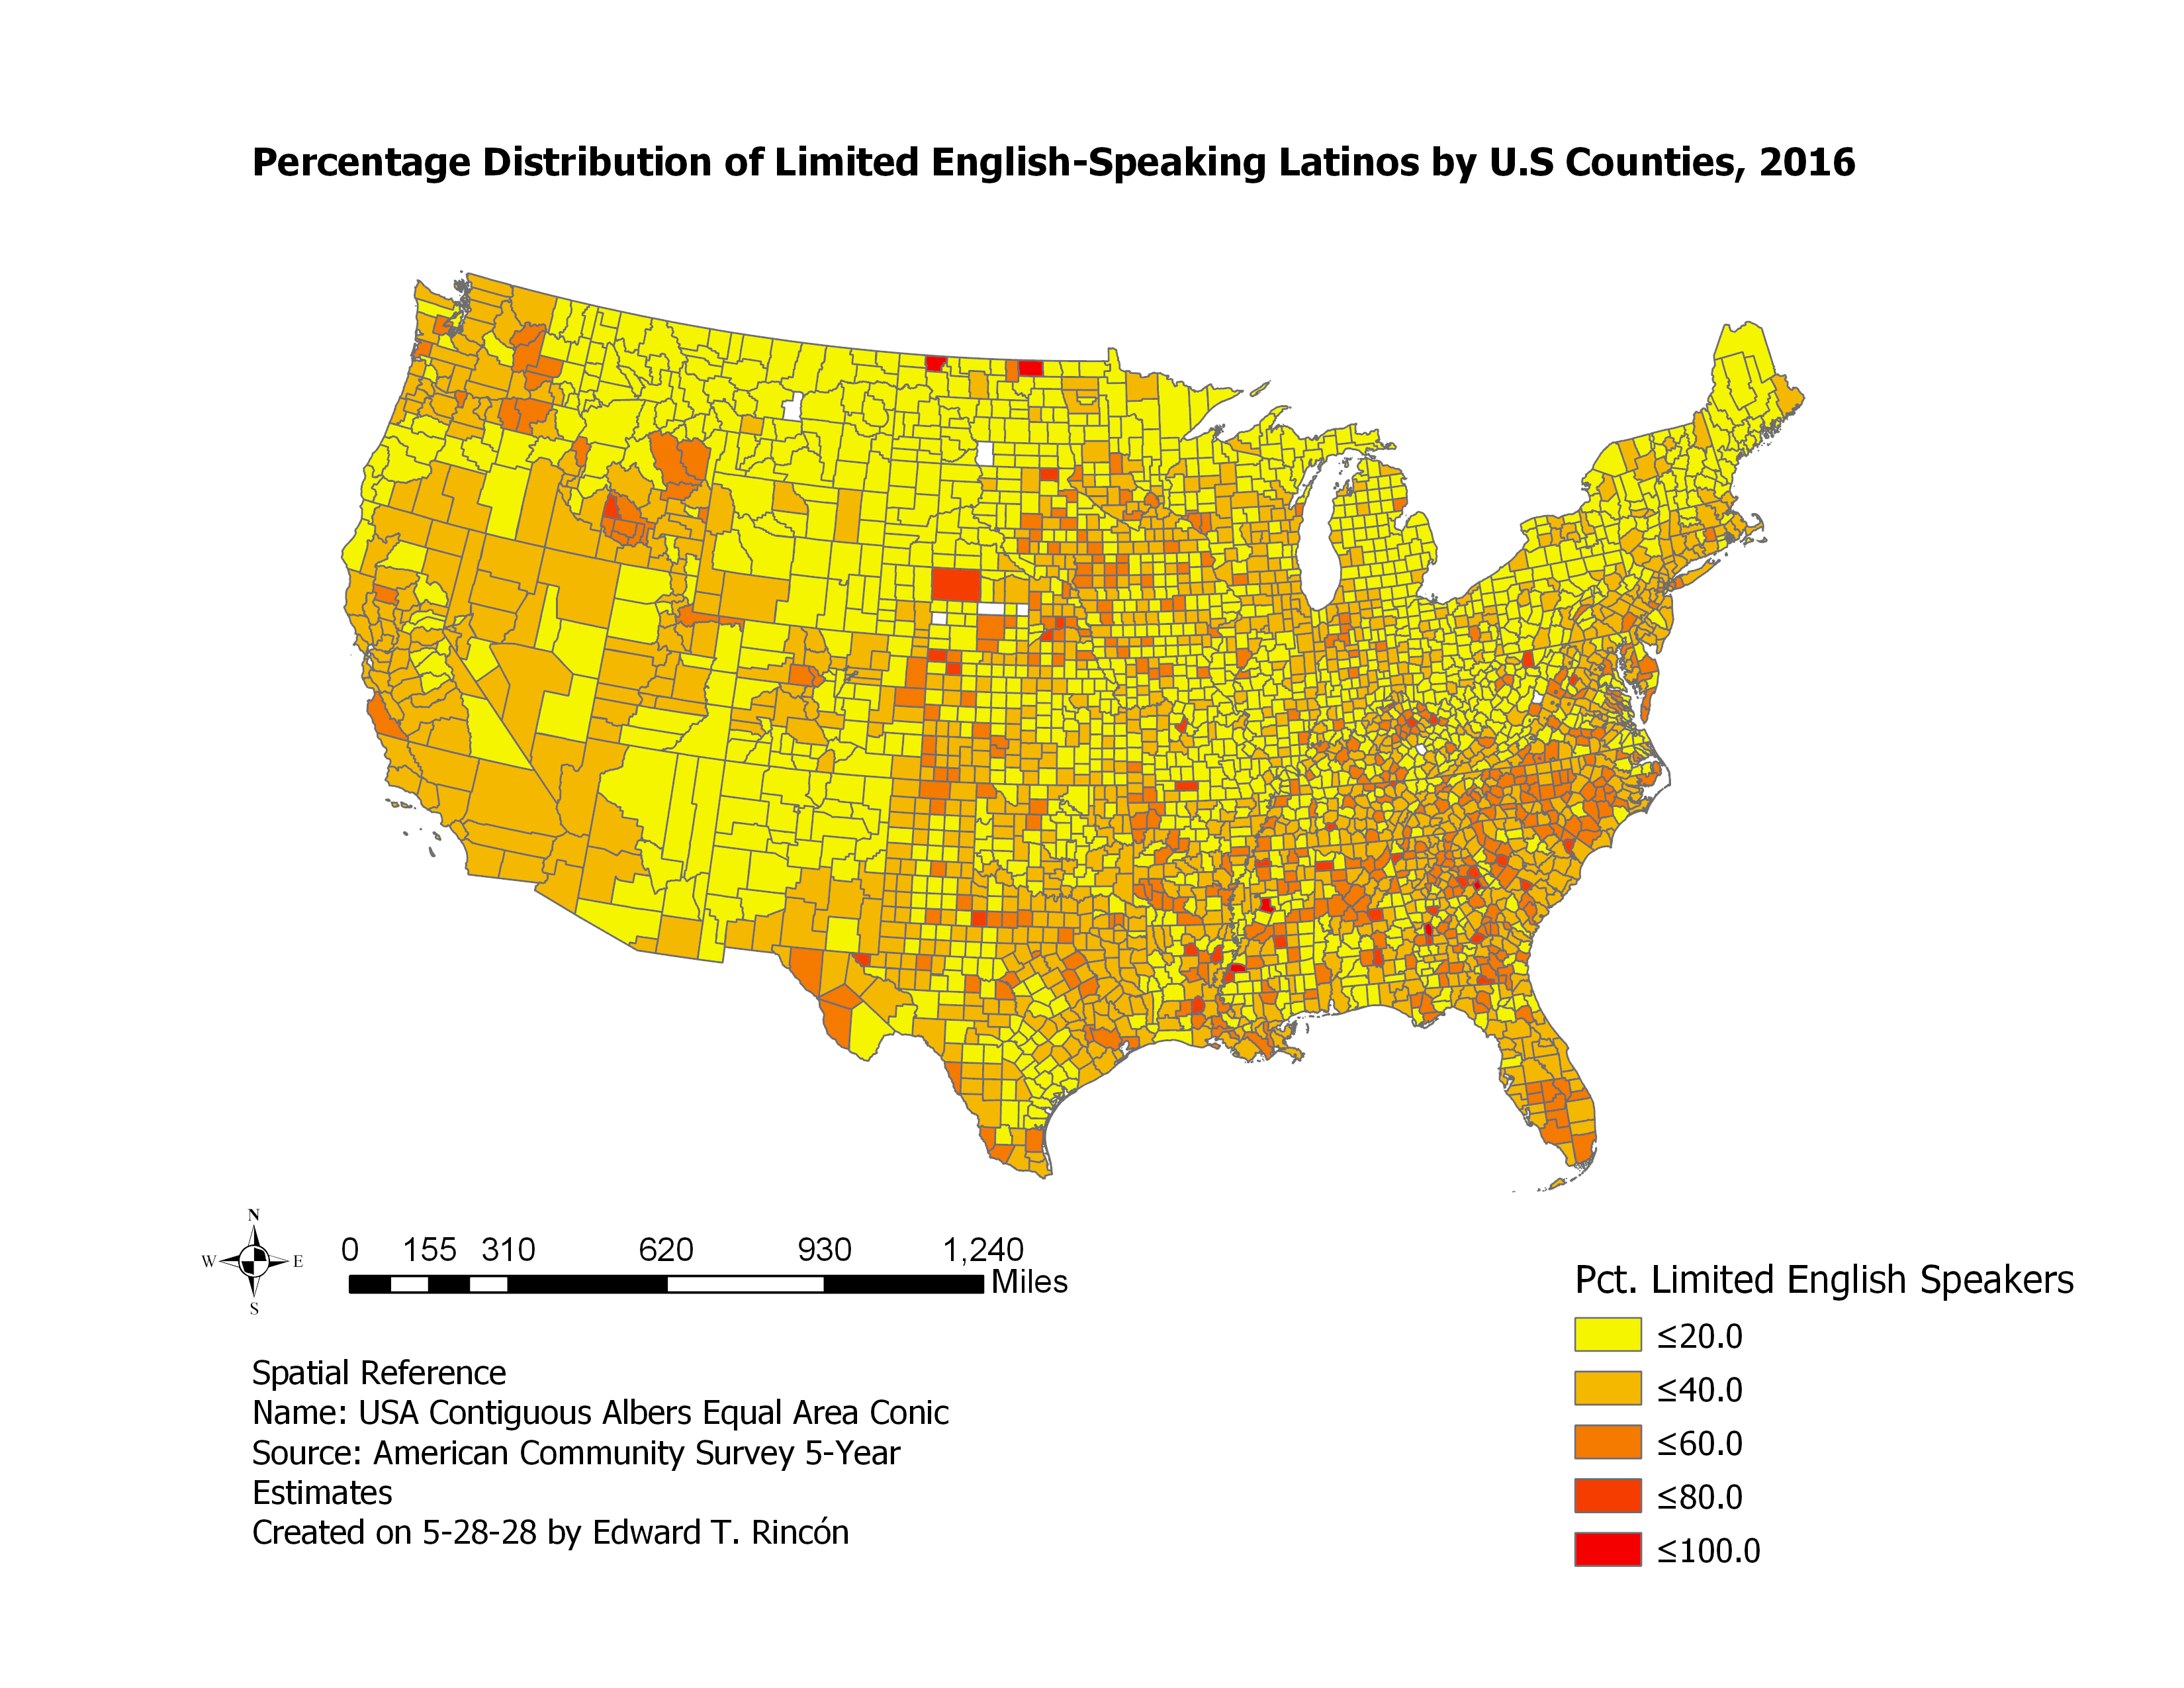
English-Language Proficiency of U.S. Latinos
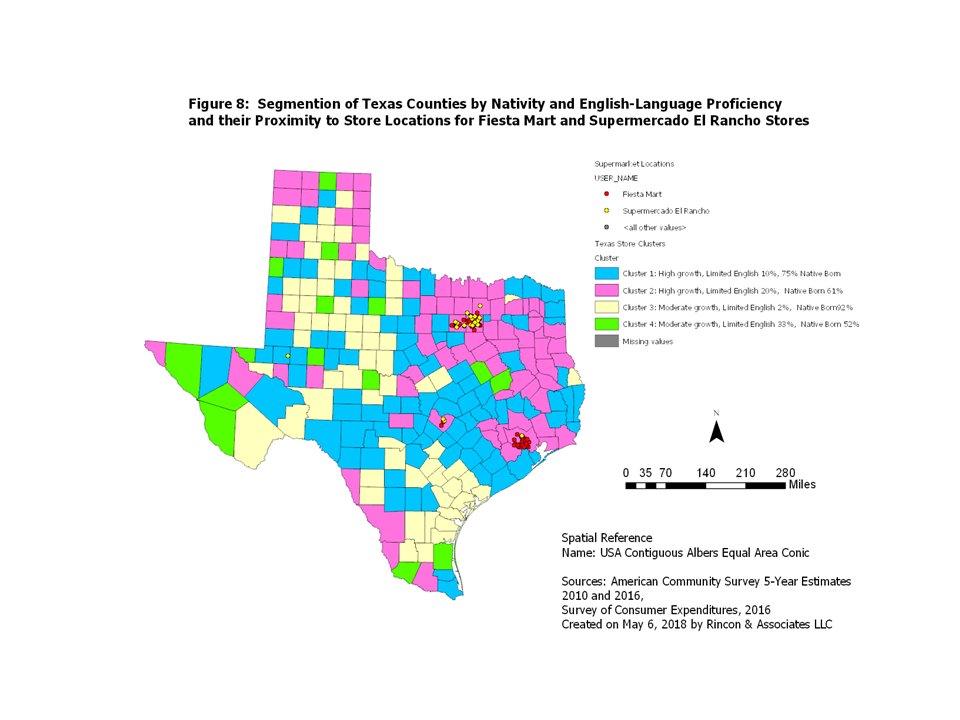
Segmentation of Texas Counties by Latino Nativity and English-Language Proficiency
Using ArcGIS Pro and ArcMap, we can conduct spatial analyses and produce map displays using secondary sources of information as well as your own customer data. To learn more about our GIS and demographic support services or request a quotation, call us at 214-750-3800.